Setup - Architecture, Load Testing Tools & Test Application
At the heart of the system are two RStudio Connect servers and a load balancer that simultaneously provides a shared file system and postgres database for the Connect servers.


We use the R package shinyloadtest provided by RStudio and the associated Java application shinycannon as load testing tools.
The functionality of the tools can be explained by the figure above:
The package shinyloadtest offers the possibility to open a shiny application and record a user session of any length. The recorded session can then be used for load testing by providing a link to the shinycannon application. A fixed number of users (so called “workers”) is specified, who try to execute the recorded session on the server as often as possible within a selected time period. Finally, a report can be generated from the collected data of the load test, which will be discussed in the next paragraph.
Test application
server <- function(input, output) {
output$distPlot <- renderPlot({
x <- rep.int(faithful[, 2], times = 1000)
bins <- seq(min(x), max(x), length.out = input$bins + 1)
hist(x, breaks = bins, col = 'darkgray', border = 'white')
})
}
Our test application is hardly different from the Shiny sample application, except for the amount of data used for the histogram. This ensures that each started session always generates enough load.
The sessions, started by the workers, can be analyzed. In our example, each worker creates about 3-4 sessions during the two-minute period, which we have chosen. The width of the blocks reflects the calculation time needed for each step in the session we recorded.
Experience: With a number of workers > 300, the first thing that can be noticed is that the blocks become wider. Furthermore, for the first time, significantly wider turquoise and yellow blocks can be seen. They describe the start of the sessions and the loading of the JS/CSS files.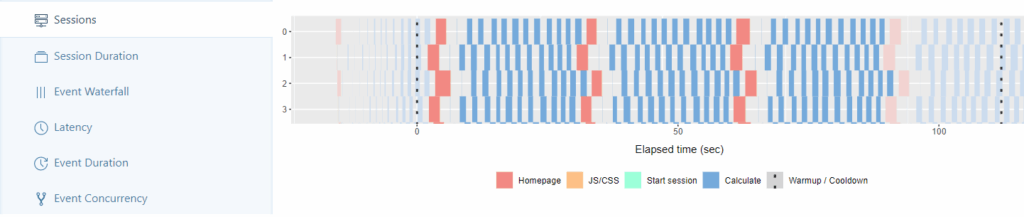
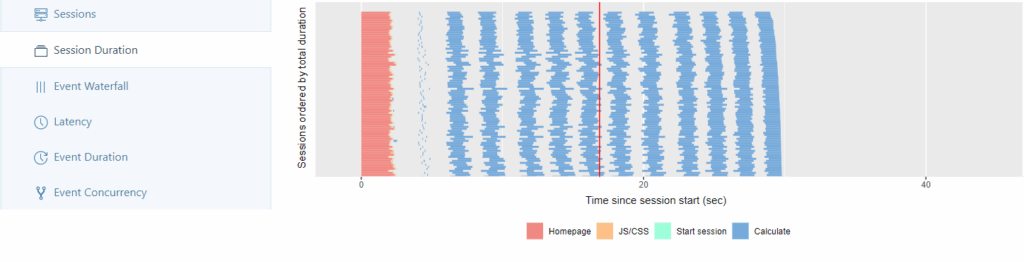
In the Session Duration tab, each started session of all workers is sorted in ascending order of execution time.
Experience: With a number of workers > 200 there is a significant increase in execution time from the last third of the sessions.
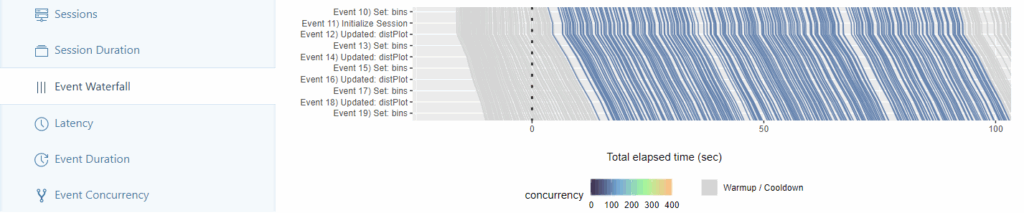
In the Event Waterfall tab the recorded session is divided into its individual events (e.g. adjusting the histogram – redrawing the plot, …). Each started session runs through all events as a line from top to bottom and is drawn according to the elapsed time. If the lines of two started sessions run parallel, they need the same time to execute the recorded session.
Experience: With a number of workers > 200, irregularities in the parallelism of the lines begin to appear, so that sessions tend to move more to the right after a certain time.
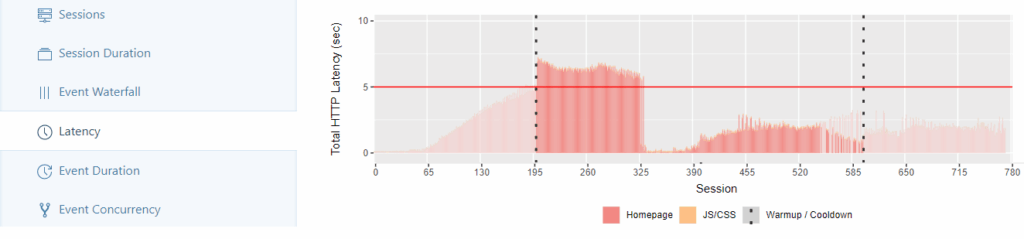
The latency tab shows for each session the time needed for HTTP requests and loading the JS/CSS files. The red line symbolizes a reference value of 5 seconds, against which the distribution of loading times can be measured (not shown here is the second tab, in which the reaction time of Shiny for calculations is measured and equivalently displayed).
Experience: With a number of workers > 200 the first sessions exceed the set reference value. With a number of workers > 400, the loading times of the JS/CSS files become noticeable for the first time.
The Event Duration tab displays a box plot for each run for each individual event, in descending order of the longest measured time.
Experience: With a number of workers > 400, the box plots for the first time consistently contain outliers over most events. Furthermore, only here significant loading times can be found for many events, which are hardly significant for runs with less workers.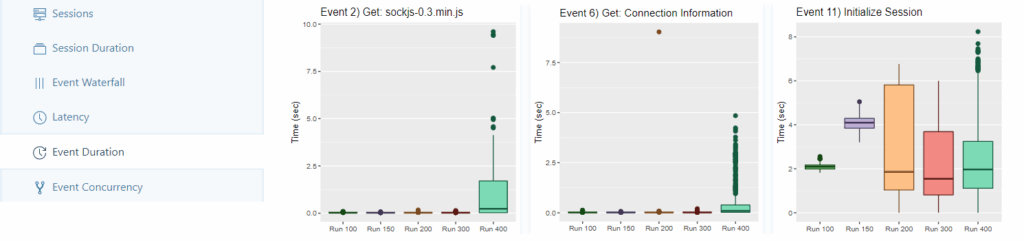
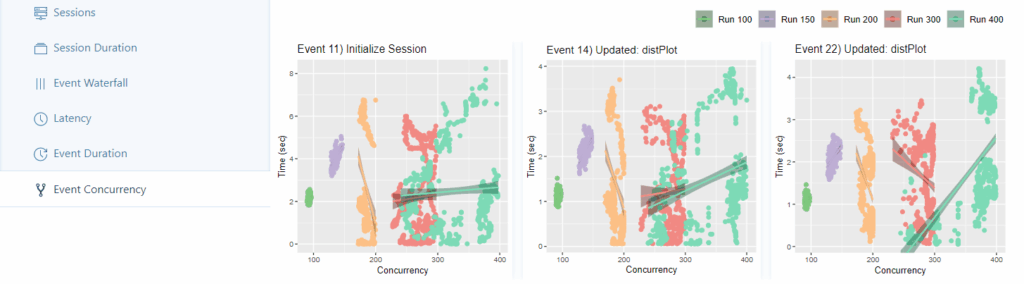
The Event Concurrency tab displays a scatterplot for each run for each event, based on the number of concurrent users. For each run, a regression line is adjusted to the plot and then sorted in descending order by the largest measured slope of the line (the other tabs are sorted by largest measured intercept/biggest measured error. You can also view the results of the regression models in the table).
Experience: With a number of workers > 300, a wider distribution of points in the scatterplot becomes apparent for the first time. The number of simultaneously active users tends towards 250 – 300 due to higher loading times. With a number of workers > 400 this interval increases to 250 – 400 simultaneously active users as expected.
Conclusion & Outlook
The step from a prototype to a business application can bring many hurdles that need to be overcome during the scaling process. In many cases, not only the usability/load capacity of the app, but also smaller problem areas are scaled to significant problems. These can also result in an unstable or faulty application. A detailed load testing can be an essential aid in identifying and eliminating potential weaknesses early enough before the application goes live. How exactly this troubleshooting can look like will be examined in parts 2 to 4 of our blog series, where we deal with the in-app optimization of Shiny applications.
Author
Get started now:
We look forward to exchanging ideas with you.

Your expert on Data-Infrastructures:
Ricarda Kretschmer
infrastructure@eoda.de
Tel. +49 561 87948-370