

The data science blog by eoda

The data analysis blog from the data science specialist: Here you can learn more about data science in a business context, technology trends, the use of the data science languages R and Python, and much more.

Our blog-posts

R-Kenntnis-Tage-Präsentation

Working efficiently with R – faster to the data product

Speaker of the [R] Kenntnis-Tage 2016: Julian Gimbel | Lufthansa Industry Solutions Julian Gimbel works as a data scientist at Lufthansa Industry Solutions. The company supports customers in digitalizing and…
RStudio_Partnership

eoda distributes and provides consulting and training on RStudio products in Europe

The data analysis specialist eoda and RStudio, provider of the popular correspondent developing environment for the open source data analysis software “R”, announce their partnership. The success of R is…
eRum2016

eRum 2016: First European conference for the programming language R
The European R community has new place to go for networking and exchanging experiences. For the first time, the Poznan University of Economics and Business hosts the European R users…
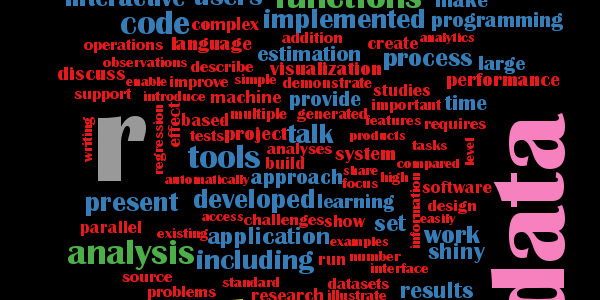
useR2016_wordcloud

Text Mining with R: Top Keywords of the useR! 2016
From June 27-30 the international R user and developer community will meet in Stanford, California for the useR! 2016 Conference. Right in the heart of Silicon Valley, gripping presentations and…
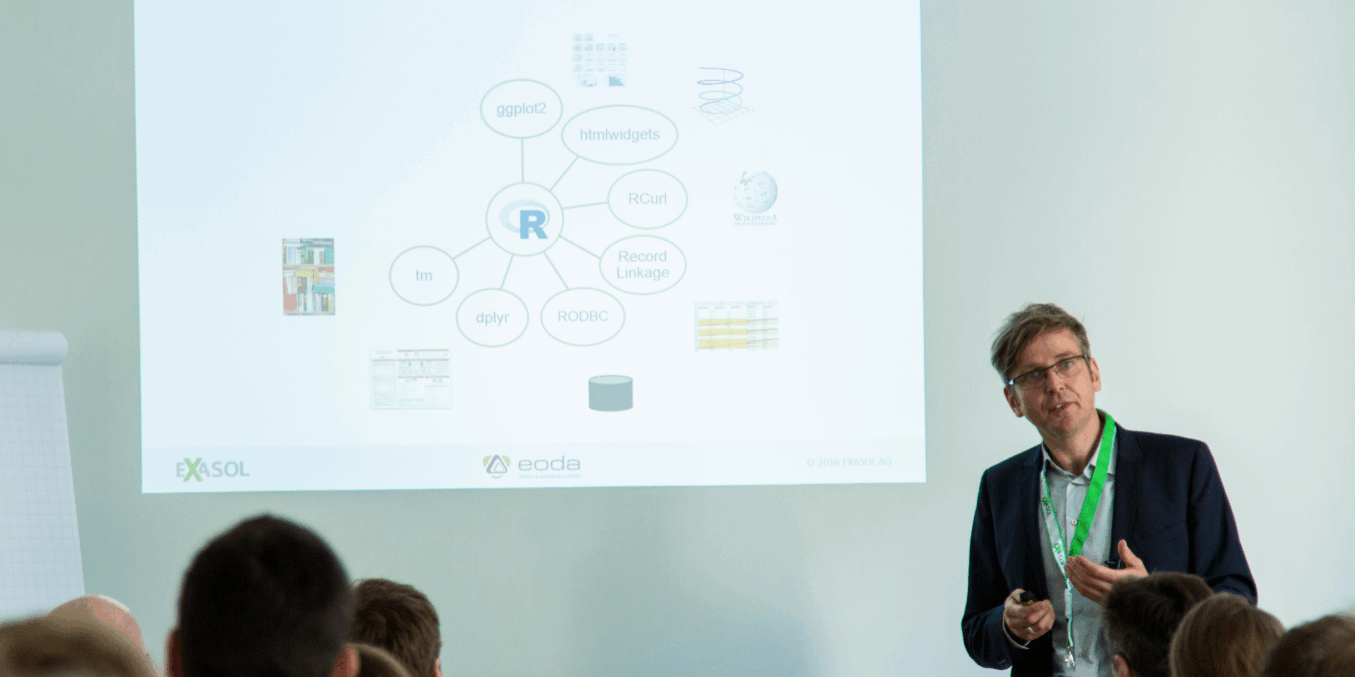
Präsentation von eoda Chief Data Scientist Oliver Bracht auf der EXASOL Xperience 2016.  ©Markus Köller, www.die-lounge.com

Data Mining with R and EXASOL

In the following you will find a simple data mining demo that shows modelling and forecasting in the connection of R and Exasol. If you have not performed the installation…

Präsentation von eoda Chief Data Scientist Oliver Bracht auf der EXASOL Xperience 2016.  ©Markus Köller, www.die-lounge.com

R + EXASOL: Installing & configuring necessary components

The following text serves as a step-by-step instruction for installing and configuring all the necessary components for the connection of R with the Exasol Community Edition in a Windows environment.…

operateR eoda

Spatial visualization with R – Tutorial

The visualization of spatial data is one of the most popular applications when using R. This tutorial is an introduction to the visualization of spatial data and creation of geographic…
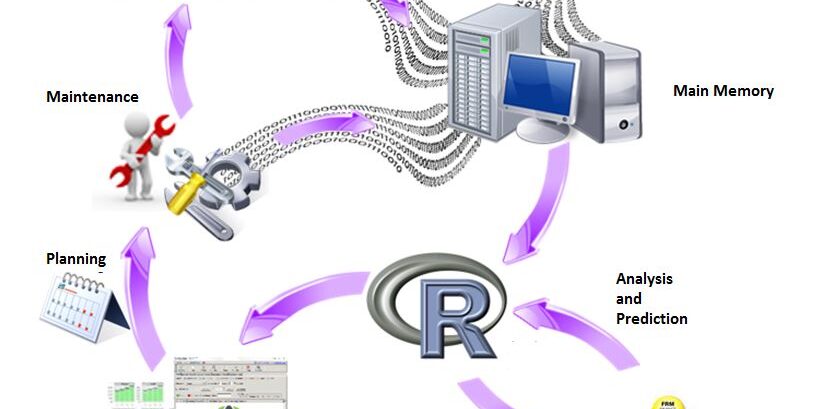
Bild-Blogbeitrag

Potential of R for Predictive Maintenance

Have you ever been asked a question starting with: “Can you use R to…“, only to politely interrupt the inquisitor at this point to reply with something similar to “Yes,…
erzeugen-sync-remote-repository

Five ways to handle Big Data in R

Big data was one of the biggest topics on this year’s useR conference in Albacete and it is definitely one of today’s hottest buzzwords. But what defines “Big Data”? And…

eoda Winterlogo

Visual debugging with StatET and RStudio

Debugging code in R R provides several built in features for stepping through code for analyzing and debugging purposes. As an example you can examine variables during the execution of…

German election: Election promises visualized with R

Data analysis is mostly focused on structured and standardized data, e. g. data from data bases, because these data can be used easily for analysis. Nevertheless even unstructured data offer…

Grafik-11

eoda offers courses for data visualization and graphics with R

Graphic modeling can be nerve-stretching and stressful. eoda’s R academy will help you to manage and facilitate your work concerning graphic modeling as there are multiple possibilities to visualize contents…

Row edge-slant Shape Decorative svg added to top
Row edge-slant Shape Decorative svg added to bottom

Get started now:
We look forward to exchanging ideas with you.


    Scroll to Top