Advantage
The application developed by eoda enables iOmx to incorporate relevant findings into research processes more quickly and support drug research.
Data
The application is used to visualise single-cell RNA sequencing data.
Solution
Like many companies in medical research, iOmx relies on the R programming language. The application was therefore developed in the established R framework Shiny.
Challenge
iOmx Therapeutics AG has a clear mission: to revolutionise cancer treatment with novel drugs based on the immune system. iOmx is convinced that efficient data analysis is a fundamental step in drug development.

Goal
The aim of iOmx is therefore to continuously improve research processes in order to create the optimal conditions for the development of pioneering cancer immunotherapies. To ensure that employees have smooth access to the analysis and visualisation of internal data sets and can use them effectively, the development of a user-friendly web application was planned. This should enable the research results and findings from iOmx's work to be presented in an accessible and interactive form.
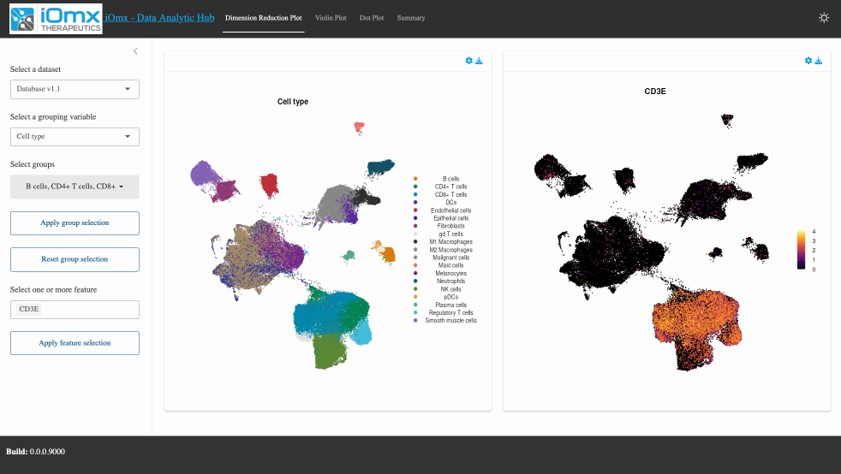
The application is intended for the visualisation and analysis of single-cell RNA sequencing data. Users can precisely display cell types and expression patterns and easily process complex data to gain valuable biological insights.
Solution
iOmx is relying on eoda's expertise in developing this application. Since iOmx, like many other companies in medical research, uses the R programming language in the field of data science, the application will be developed using the R framework Shiny.
Based on Shiny, eoda has developed the application, which combines the following functionalities:
- Importing data sets from single-cell sequencing in the fast and efficient .qs format
- Selection of genes or gene lists for subsequent visualisation with the R package Seurat
- Use of dimension reduction methods (e.g. UMAP, t-SNE) to display clusters and expression patterns of high-dimensional data
- Display of data using violin plots, dot plots and heat maps
- Display of simple summary statistics in tabular form
- Export of results and displays

Result
The Shiny application developed by eoda enables all iOmx employees to analyse large curated data sets and create publication-quality illustrations. This allows relevant findings to be incorporated into research processes more quickly and can support drug research.
Get started now:
We look forward to exchanging ideas with you.

Your expert on Data-Science-Projects:
Lutz Mastmayer
projects@eoda.de
Tel. +49 561 87948-370