Graphic modeling can be nerve-stretching and stressful. eoda’s R academy will help you to manage and facilitate your work concerning graphic modeling as there are multiple possibilities to visualize contents appealingly. R provides features to create several kinds of graphics like boxplots, histograms, or scatterplots. The following graphics shall demonstrate different possibilities of data visualization with R exemplarily:
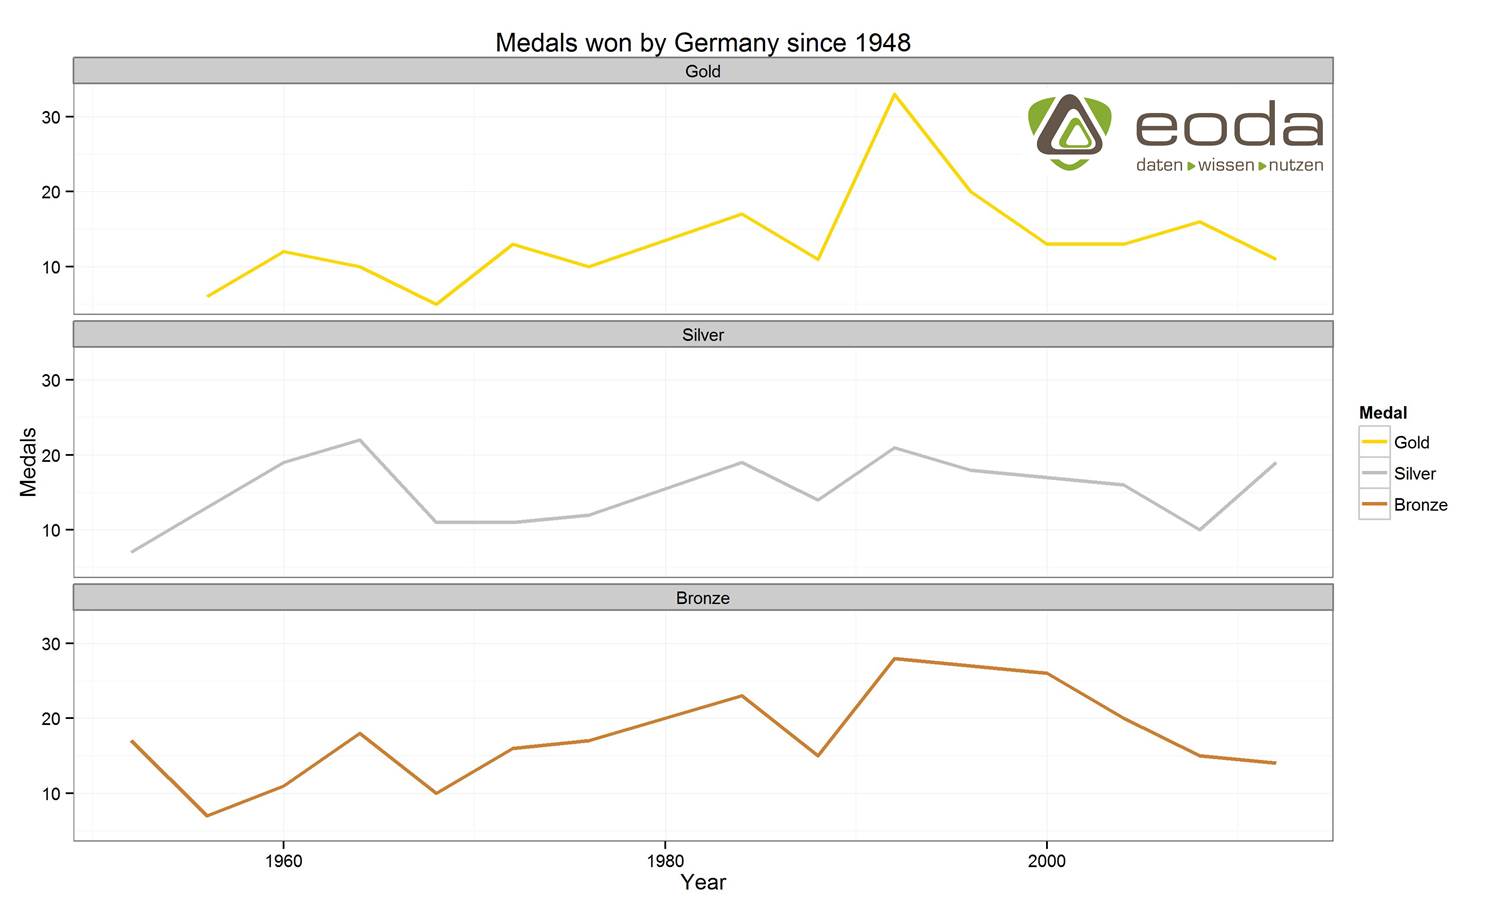
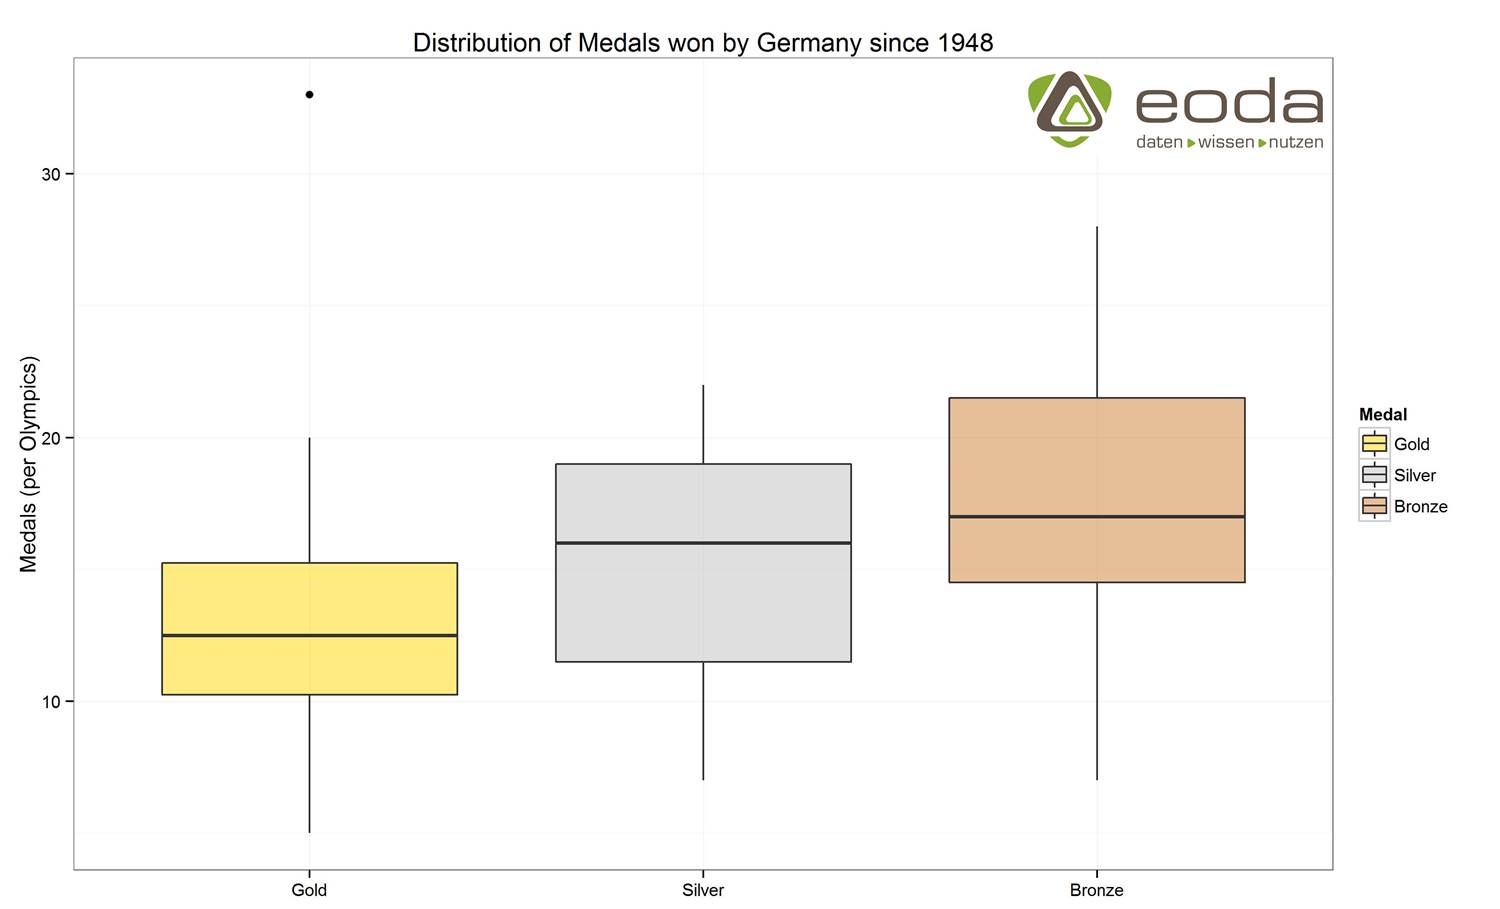
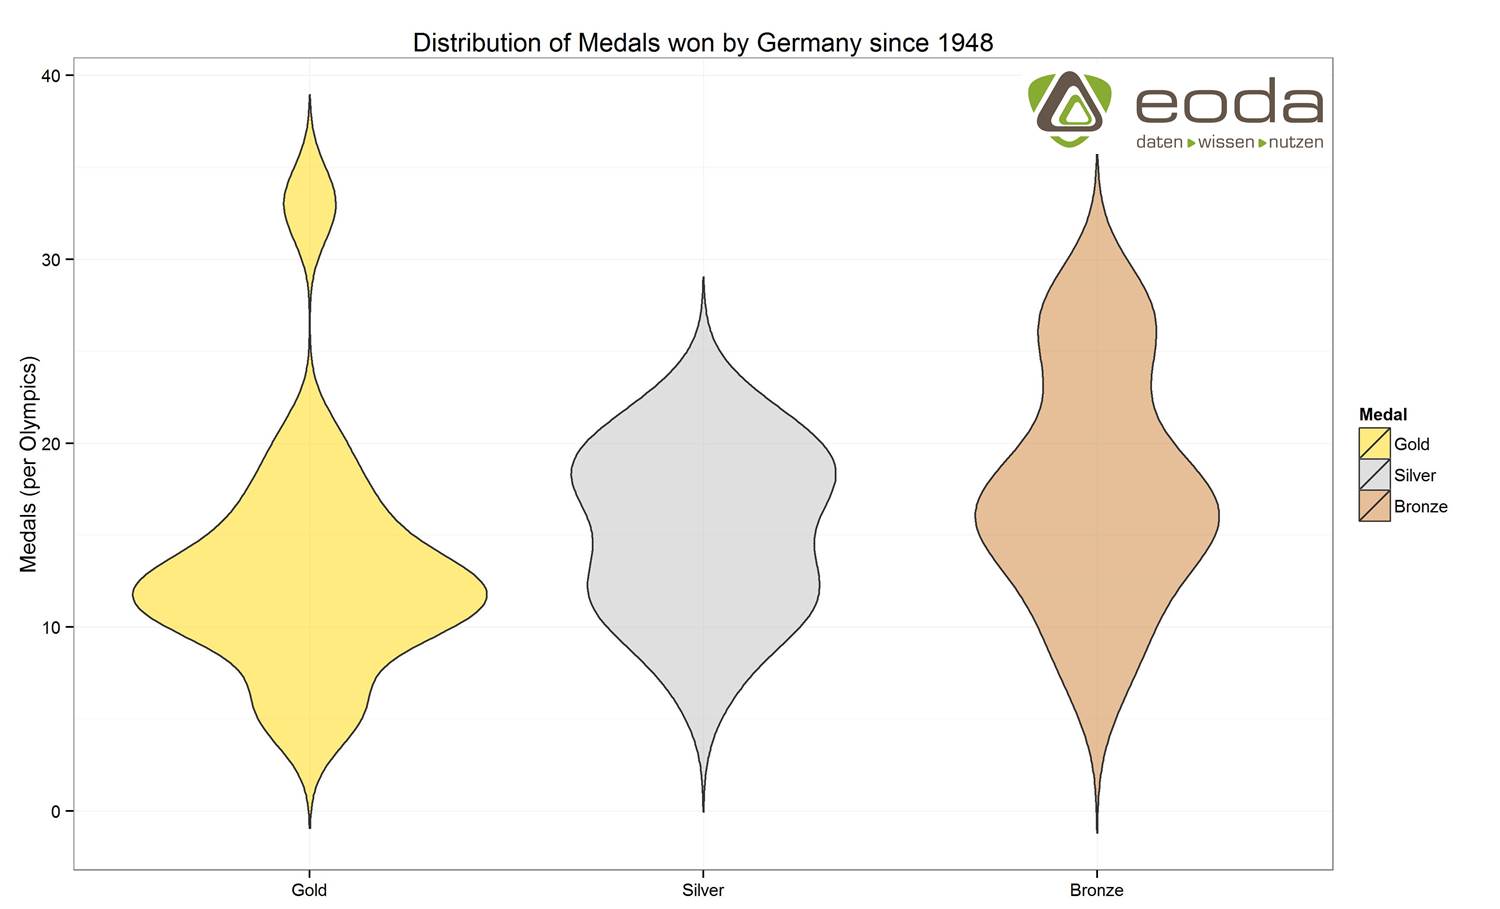
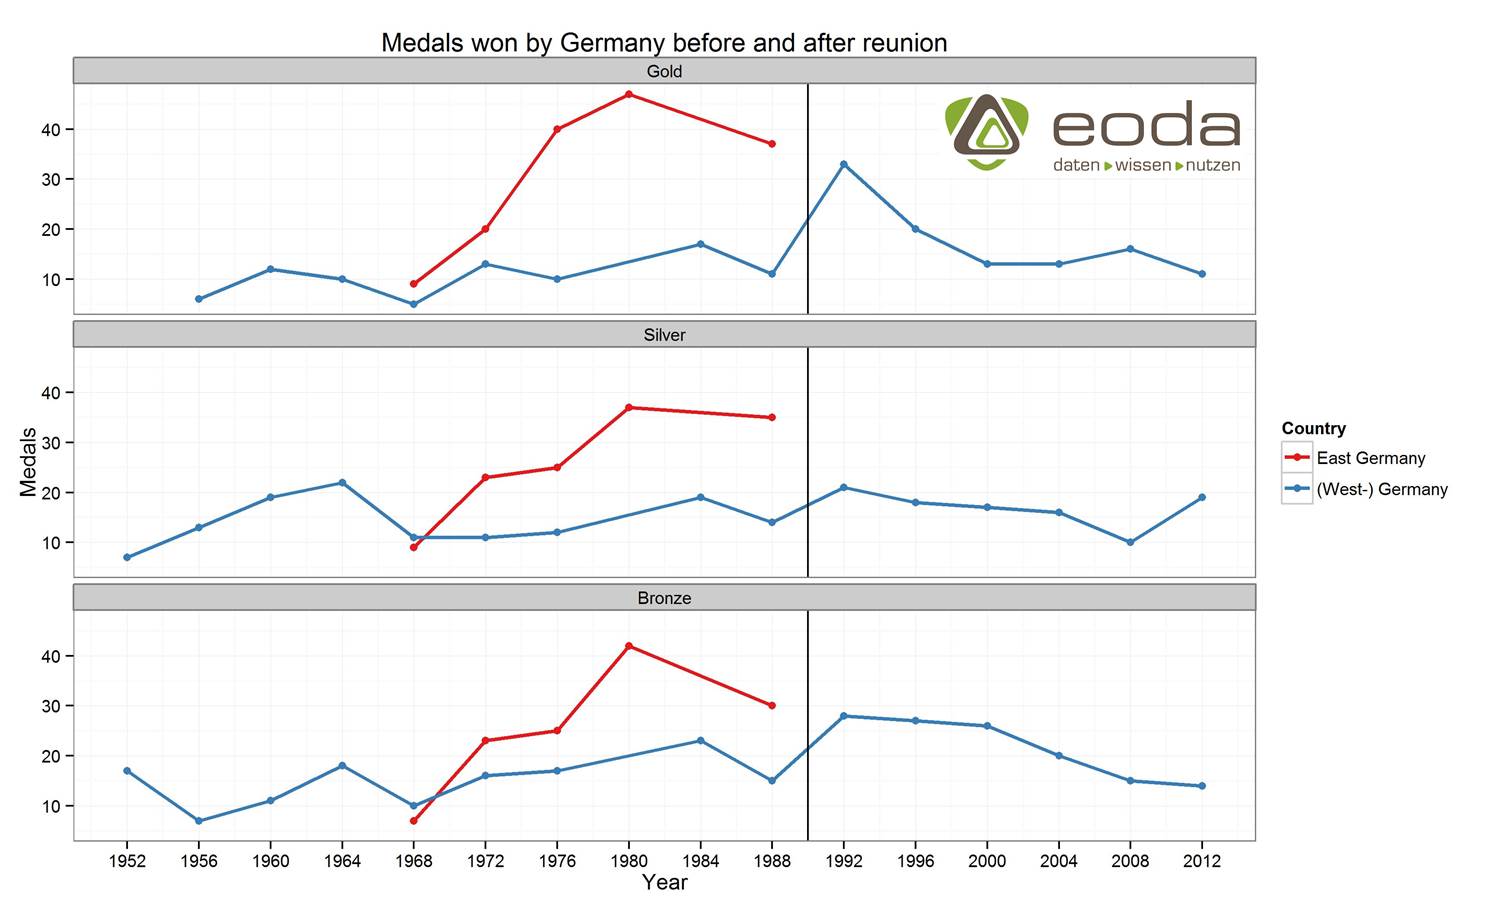
In the following three different possibilities are shown to visualize medals won by German athletes in Olympics since 1948.
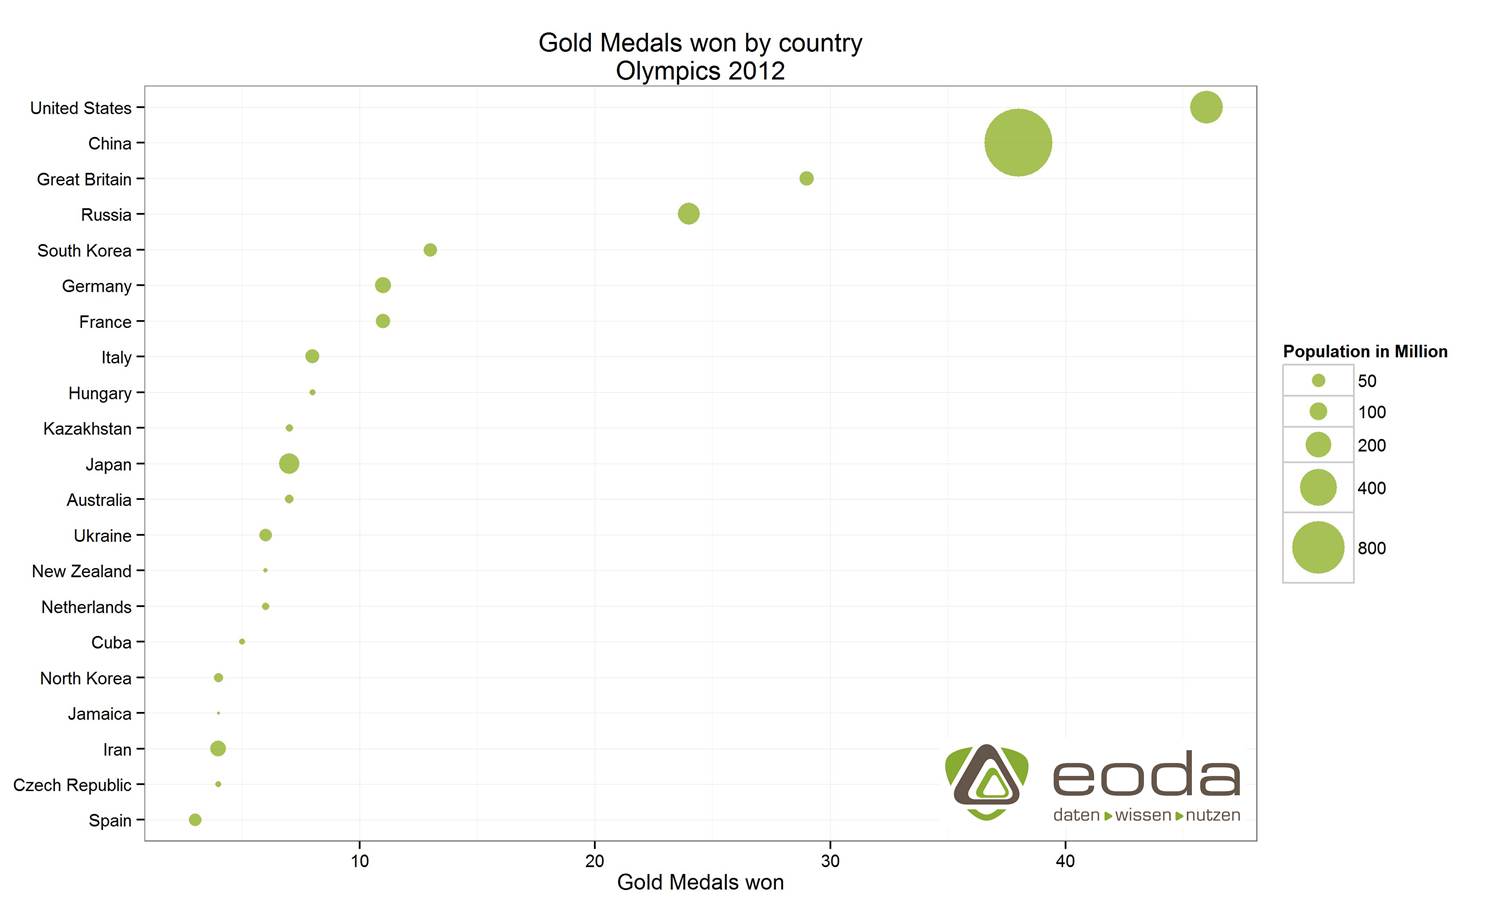
R can also be used efficiently to visualize comparative data:
eoda offers a two-day-course that will treat the standard options for graphic development in R as well as useful additional packages. eoda’s experienced trainers will give you an introduction into packages like ggplot2 or grid, on which further packages are based upon. The course’s goal is to enable the participants to apply R’s possibilities for graphic development and to model even complex multi-layer graphics according to individual needs. Furthermore low-level functions that can be added to existing graphics will be touched as well as the device option to save the graphics, charts and diagrams. The course will also cover possibilities to export graphics modeled in R. Additionally it will be demonstrated how the participants can visualize geographic data in R. The next “graphics with R” course will take place from October 22nd to October 23nd and will be followed by a course about “interactive graphics with R” on October 24nd which is recommended for more experienced users or participants from the basic “graphics with R” course which are interested in deepening the topic.
This way.