
rstudio::global 2021 - Review of 24 hours around Data Science and R
With over 17,000 participants, 50 speakers, many talks and interesting insights: That was rstudio::global 2021. We look back for you. We followed the rstudio::global for you and give you insights into a selection of the most exciting talks for us.
1. Your R is My R too: Reflections on creating the Mi-R community (Speaker: Danielle Smalls-Perkins)
The global R community has made progress in the participation of female users from ethnic minorities. This development is to be further advanced. Against this background, a very special community was founded six months ago: Mi-R (Minority R). This talk reflected on the challenges and highlights of the first six months since Mi-R’s inception and outlined future plans. We think this initiative is great!
2. Reporting on and visualizing the pandemic (Speaker: John Burn-Murdoch)
John Burn-Murdoch is a journalist in data visualization at the Financial Times and creator of the Coronavius Trajectory Tracker Chart. According to Burn-Murdoch, visualizations need to be clearer, easier and faster to access. To be able to implement this, he said, you have to ask yourself this question from the beginning. Also, one should be “careful” when producing data visualizations for the “masses,” as pitfalls can quickly be encountered. In addition, even simple adjustments in the presentation can lead to a completely different opinion.
He refers to a scientific study on the recording of visualizations. He says that titles/headings attract a lot of attention and thus have a high significance. For example, a great graphic is of little value if the title/description doesn’t fit. He also mentions how important people’s feedback is to improve one’s skills and reach even more people.
He also goes into the genesis and design of the Corona Trajectory Tracker, especially the changes made to the graphic in the making with regard to large numbers of non-skilled recipients (inserting enabling titles, more descriptions/text). On the right side, some tips for good graphic creation are given.
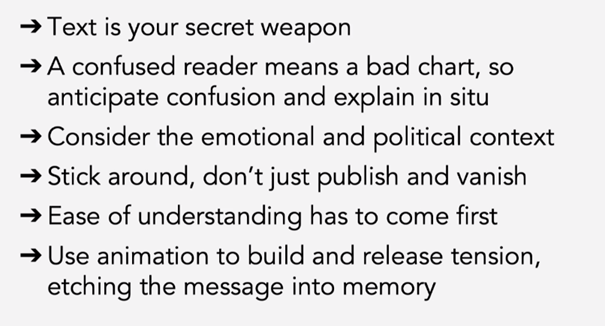
It is important to be aware of what the takeaways of the recipients are. The question should be what content questions the graphic should answer for them rather than how the visualization is designed. Specifically, he addresses Log Scale (logarithmic representation), for example, which can confuse many recipients.
He distinguishes between two stocks: People who look at graphs/visualizations analytically and others who see them primarily as a signal of whether the situation is good or bad. In doing so, he sees the risk of scaring people off with too scientific an approach (terminology, methodology).
Burn-Murdoch also addresses the role of animation in visualizing data – interactive visualizations are gaining relevance in science and business practice and can cause a much stronger response from the recipient.
Summary: Exciting and relevant topic – Burn-Murdoch has been able to gain a great deal of experience through the popularity of his graphics and thus his core message is: Focus on the comprehensibility and message of the visualization rather than the methodology!
3. Fairness and Data Science: Failures, Factors and Futures (Speaker: Grant Fleming)
In this talk, Fleming reports on how quickly statistics can be influenced by factors that may not be directly visible – even though one has done one’s job to the best of one’s ability. Using crime rates that have taken on a subliminal racial component, the speaker explains the sampling bias even though the data analyses performed were correct.
The focus of this talk was that such data analyses should always be looked at with different perspectives. In addition, models should be cross-checked with other factors in order to exclude unintentional classifications. This talk showed that errors can creep into the models. If they are then used in the real world despite the errors, false predictions occur and eventually affect people.
4. Bringing the Tidyverse to Python with Siuba (Speaker: Michael Chow)
This talk was about a Python package that goes in the direction of the tidyverse package (R). Tidyverse is very popular in data management because it is user friendly and easy to read. The Python package Siuba allows to copy the R code where a dplyr code was used more or less 1-to-1 to Python (after minimal adjustments). The idea is to write e.g. codes for data management first in R, because it is more intuitive there and then migrate it with Siuba to Python, because it runs more performant there.
5. The dynamic duo: SQL & R (Speaker: Irene Steves)
According to Steves, there comes a point in every data wrangler’s career when the entire data set no longer fits just in CSV files and the journey into the database world begins. In this talk, the author gave a good overview of the different ways to interact with databases from within R and explains how she uses R & SQL to access database tables. She also highlights the differences between direct database access and helper packages (e.g. dplyr) and shows how each package works.
6. R & Python: Going Steady (Speaker: Sean Lopp)
In this talk, engineer, data scientist and product lead Sean Lopp tells us that using RStudio Server and RStudio Connect, you have a basic platform on which to work with R and Python. Regardless of whether Data Scientists are working with R or Python, no different systems are set up. It ends up setting up one system where everyone can work together. RStudio products have some cool features. One example is that you can still work with different IDEs on RStudio Server, i.e. in addition to RStudio, you can also work with JupyterLab or Visual Studio, for example. With RStudio Connect, not only Shiny Apps, but also apps developed with Dash (Python) can be deployed. In addition, RStudio itself offers more and more convenience functionalities for working with Python.
7. Maintaining the House the tidyverse built (Speaker: Hadley Wickham)
This talk was about how tidyverse has evolved since its inception and how to evolve these packages without compromising the existing code. This approach is not easy and can be seen as an act of balance. To understand how the features are used in practice the developers look at other packages on Cran. In turn, they turn to tidyverse and search Github for examples.
As a Full Service Certified Partner, we are the contact for RStudio interested parties and users in German-speaking countries. Consulting, procurement, integration, training: Learn more about our offer around RStudio. Contact us!