

The Data Science Project Platform
The driving force behind your data-driven innovations and projects. Don’t ever again accept trade-offs when it comes to concept development and go-live – YUNA makes your project a reality.

YUNA – Data Science Project Platform
The driving force behind your data-driven innovations and projects. Don’t ever again accept trade-offs when it comes to concept development and go-live – YUNA makes your project a reality.
Empowering Data-Driven Intelligence together
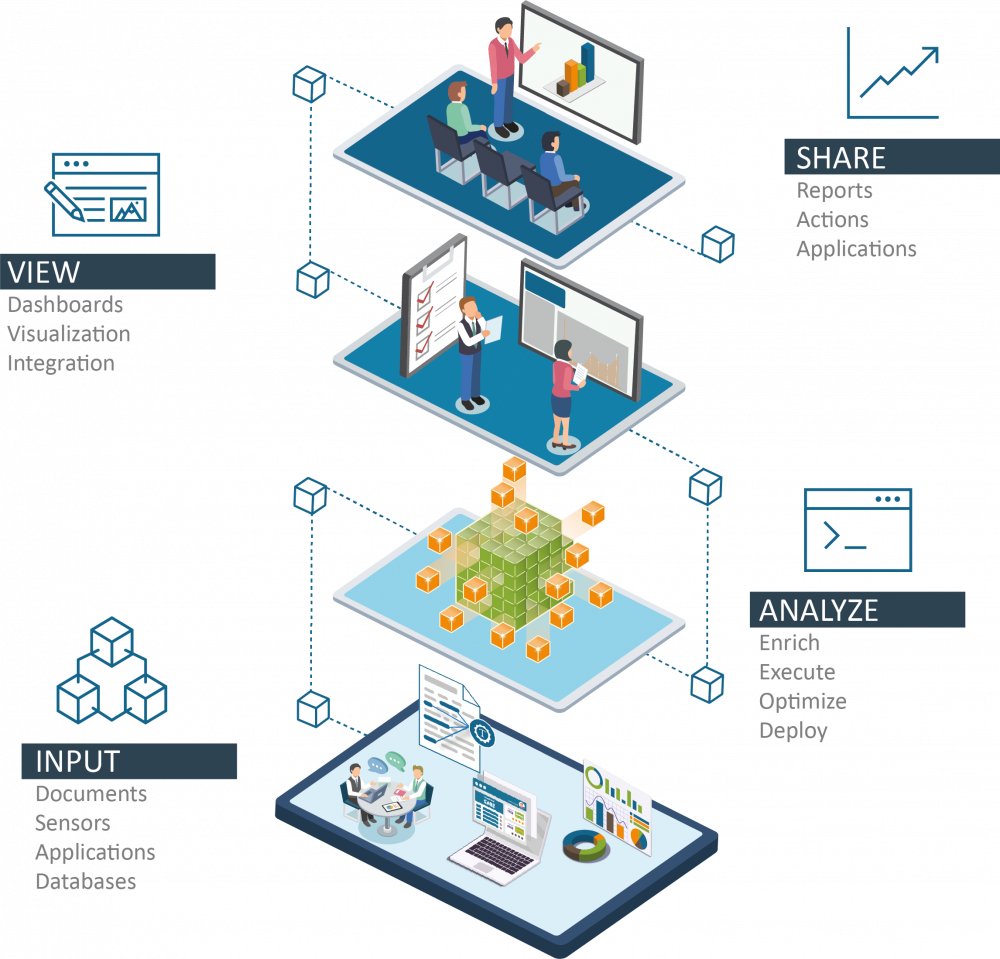
With YUNA, various data-driven use cases can be centrally managed and controlled, analysis results evaluated, visualized and made available, so that everyone in the company can use the full data potential. As a central platform, YUNA offers your company:
- Automation of processes
- Advanced data analytics
- Scalable architecture
- Data governance functions
- Simple and secure information distribution both internally and externally
- Functions for the realization of an increasing number of new use cases
- Adjustment and optimization of analyses in productive use
Revolutionize the way you use data and
realize successful AI and automation projects!
Key Features
Optimize analyses, detect model drifts and data labelingEvaluate and optimize analytics results. Algorithms provide results – people provide the expertise. YUNA provides a intuitive Data Labeler, that brings it all together in one function and keystroke. This feature makes it possible to move from pure anomaly detection with unlabeled data and unsupervised learning to labeled data and predictions through supervised learning. More: The same feature can be used to tune your analytics models! User can give feedback about the accuracy which in return is used to optimize the algorithm! |
 |
 |
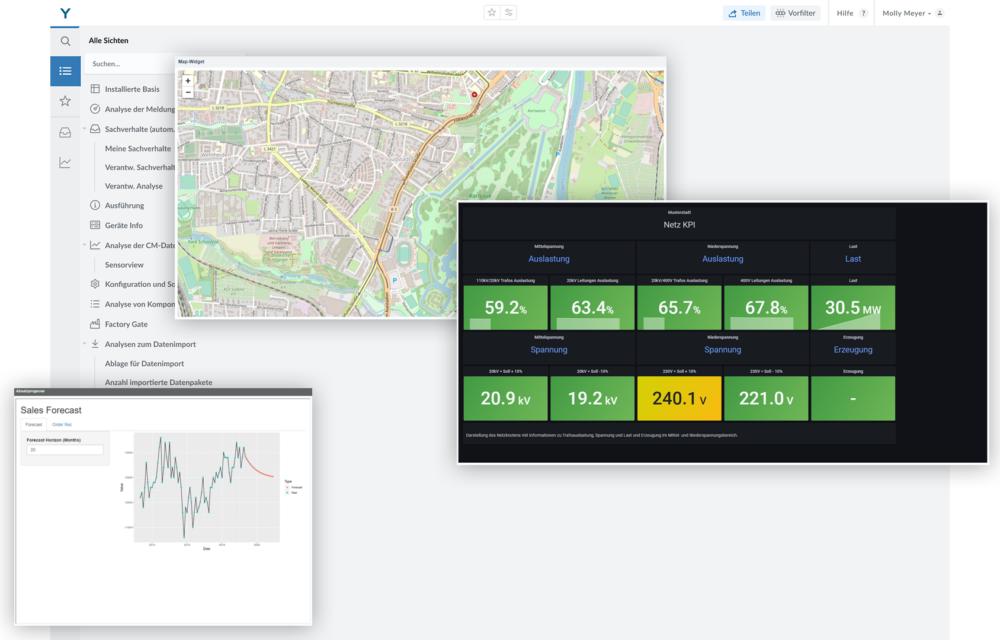
DashboardingGo from mockup to custom view in just a few steps – Use and customize ready-made widgets. This creates customized dashboards, with exactly the information every team member in the company needs! Easily share dashboards with others and/or roll them out company-wide. Also possible: a dashboard that presents itself differently depending on the rights – / role concept. |
Filter and database in oneUse custom filter categories and SQL statements to filter intelligently. Once filtered, views can be shared with Data Scientists who use the filters as Data Sets and apply algorithms to them. Even more, filters can be edited collaboratively and also shared among users – so exporting data is no longer necessary! |
 |
 |
AutomateStart processes and analyses, run reports and alerts to react and make better decisions at any time. |
Visualize, provide, decideDisplay analysis results fully automatically as a table, chart or image. Make better decisions faster with data support. Use views as the basis for new analyses and create new analysis packages. Even more: Never share screenshots or settings again! With YUNA you can easily share your content via link – all settings remain intact. So colleagues can continue to work directly, without a phone call, screenshare or passing through settings. |
 |
 |
Cyclic analyses and moreQuite simply select one or regular time points to start their analyses. Well planned, they collide so never again other processes. |
Integration of Shiny and moreView and interact with HTML content directly in the dashboard. One Shiny app for different groups and users? No problem. Integrated with YUNA, apps like Shiny can leverage filtering and permissions cloning concepts from YUNA – instead of building Shiny apps for each individual group, one is now enough! |
 |
Key Features
Simplify the generation, overview, control and active management of Data Science processes out of the box with YUNA!
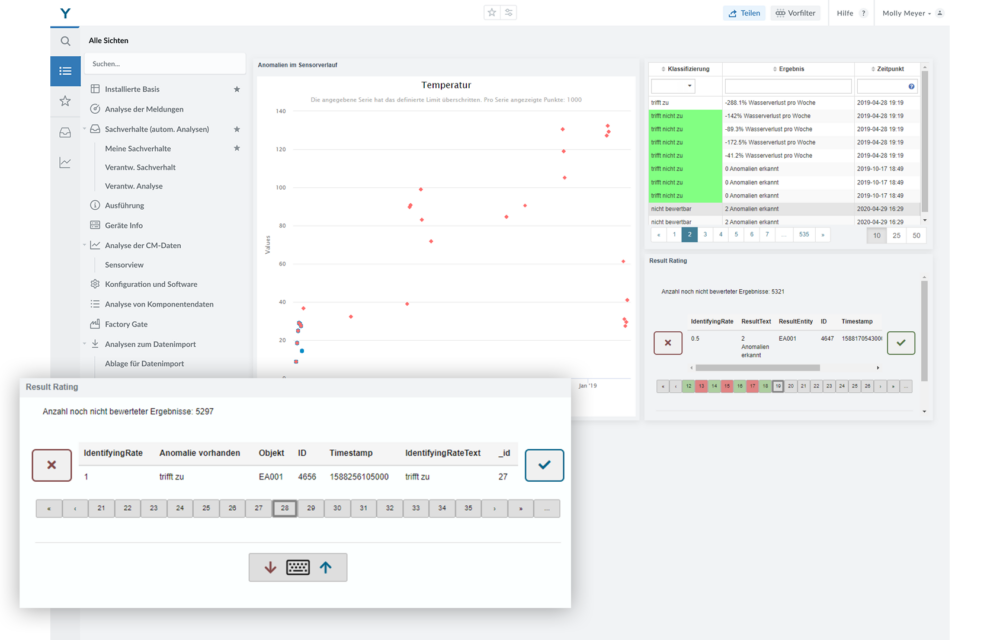
Optimize analyses, detect model drifts and data labeling
Evaluate and optimize analytics results. Algorithms provide results – people provide the expertise. YUNA provides a intuitive Data Labeler, that brings it all together in one function and keystroke. This feature makes it possible to move from pure anomaly detection with unlabeled data and unsupervised learning to labeled data and predictions through supervised learning.
More: The same feature can be used to tune your analytics models! User can give feedback about the accuracy which in return is used to optimize the algorithm!
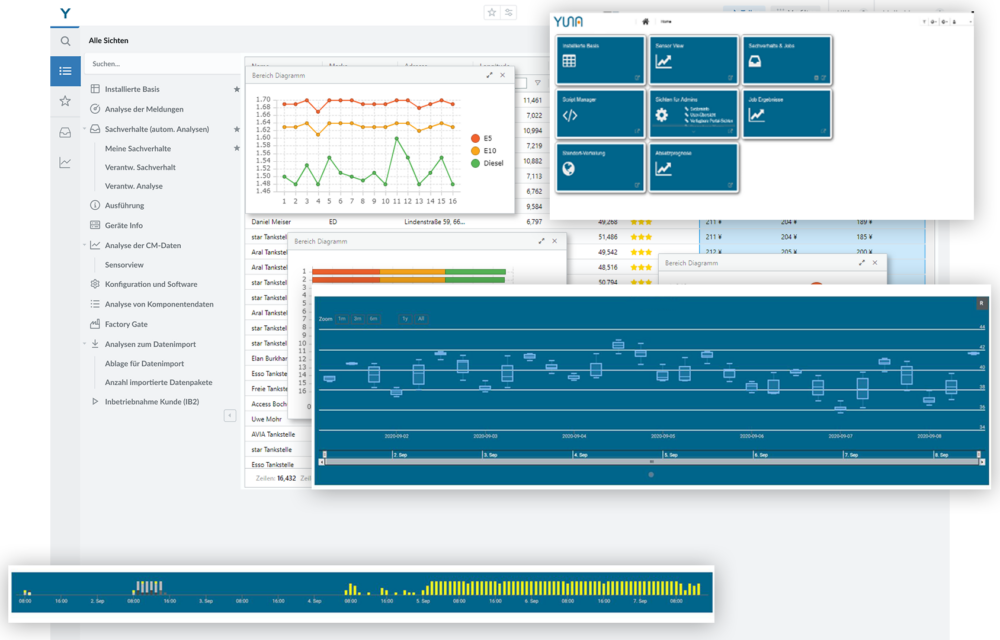
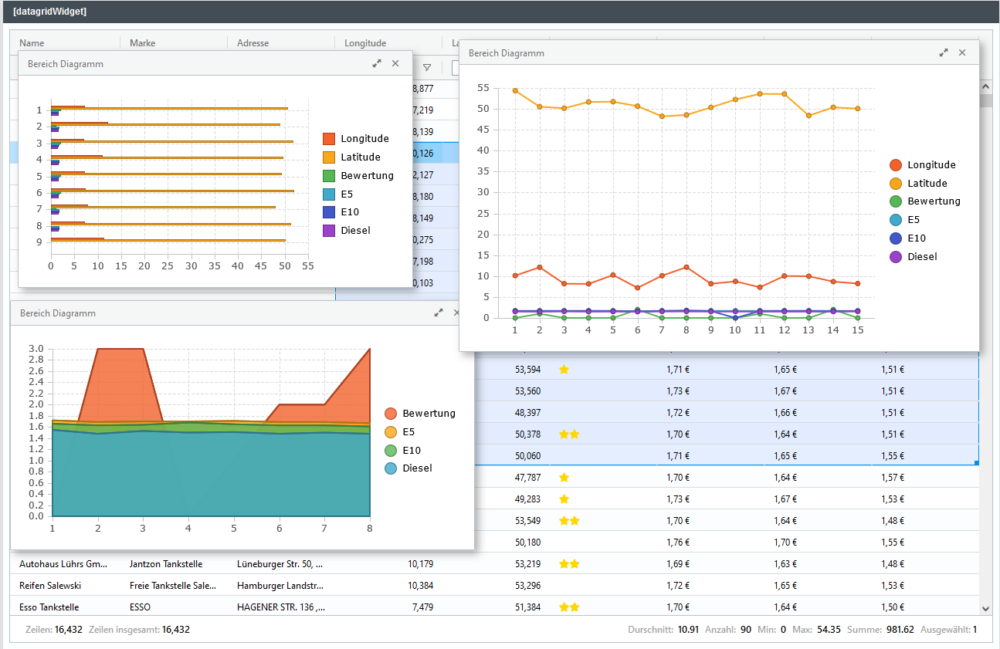
Dashboarding
Go from mockup to custom view in just a few steps – Use and customize ready-made widgets. This creates customized dashboards, with exactly the information every team member in the company needs! Easily share dashboards with others and/or roll them out company-wide. Also possible: a dashboard that presents itself differently depending on the rights – / role concept.
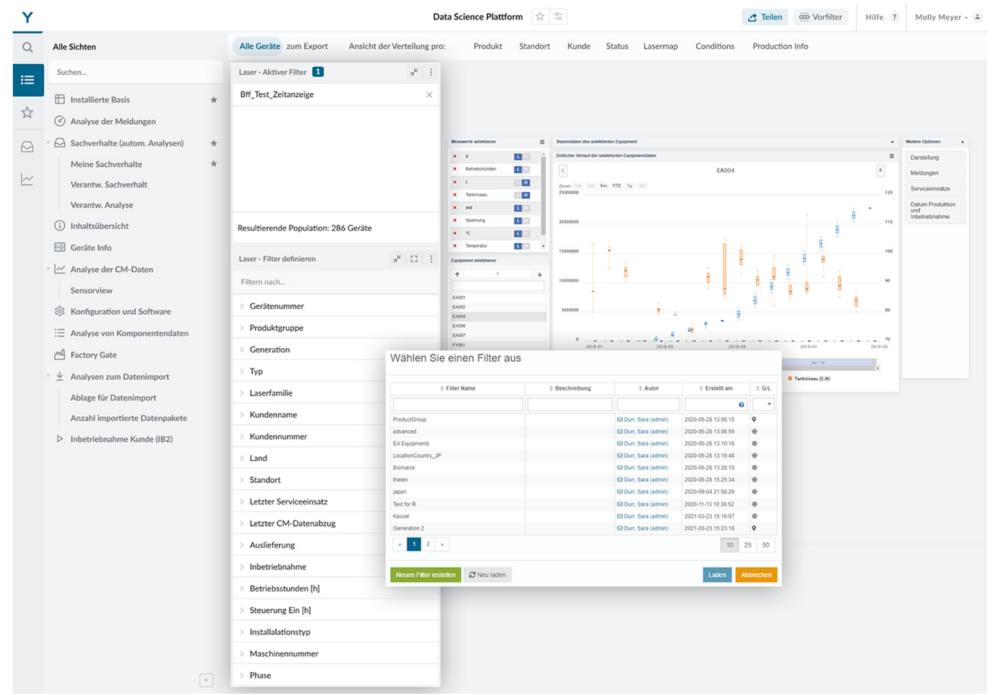
Filter and database in one
Use custom filter categories and SQL statements to filter intelligently. Once filtered, views can be shared with Data Scientists who use the filters as Data Sets and apply algorithms to them. Even more, filters can be edited collaboratively and also shared among users – so exporting data is no longer necessary!
Automate
Start processes and analyses, run reports and alerts to react and make better decisions at any time.
Visualize, provide, decide
Display analysis results fully automatically as a table, chart or image. Make better decisions faster with data support. Use views as the basis for new analyses and create new analysis packages.
Even more: Never share screenshots or settings again! With YUNA you can easily share your content via link – all settings remain intact. So colleagues can continue to work directly, without a phone call, screenshare or passing through settings.
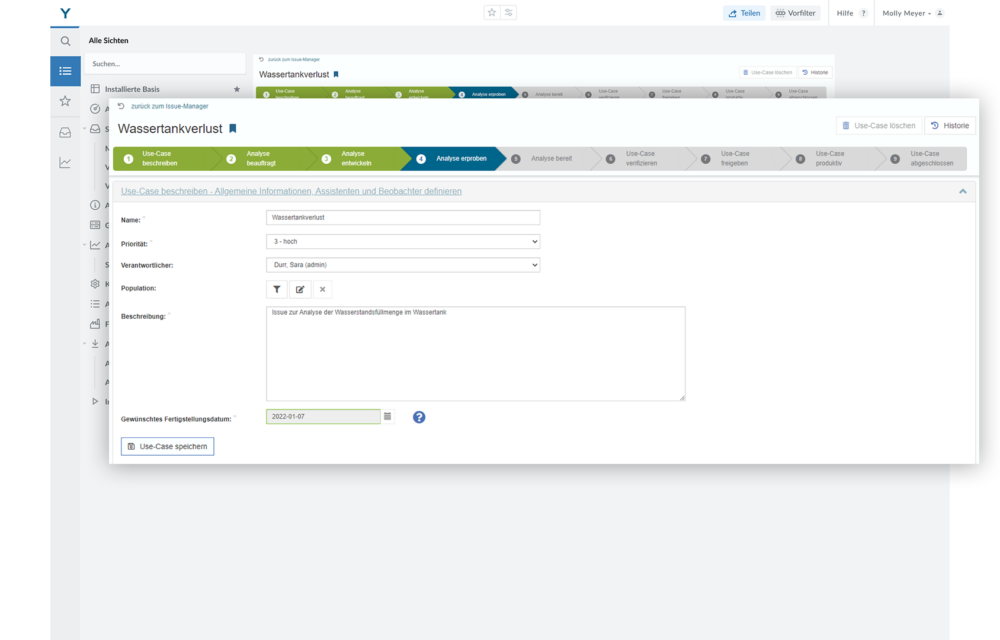
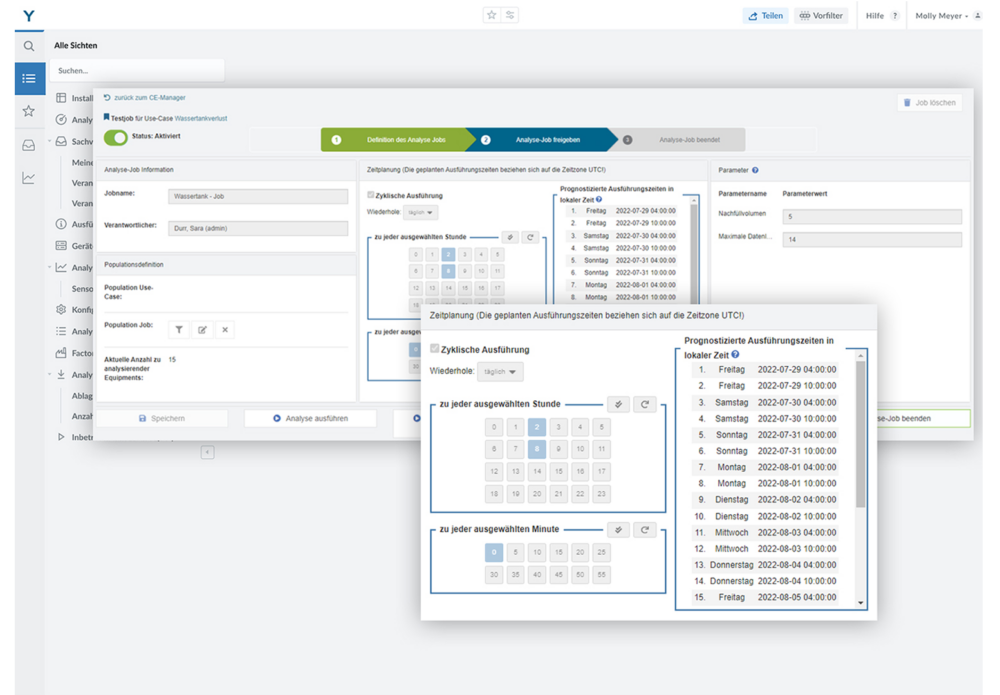
Cyclic analyses and more
Quite simply select one or regular time points to start their analyses. Well planned, they collide so never again other processes.
Integration of Shiny and more
View and interact with HTML content directly in the dashboard. One Shiny app for different groups and users? No problem. Integrated with YUNA, apps like Shiny can leverage filtering and permissions cloning concepts from YUNA – instead of building Shiny apps for each individual group, one is now enough!
Leverage the full potential of data and
get answers to questions you hadn’t thought of before!
| “What a powerful tool and what creative people who came up with it.” |
|
AI expert for the manufacturing industry | Podcast “KI in der Industrie”
| „With YUNA eoda enables us to fix problems before they actually occur. Thanks to real-time data evaluation, we reduce downtime, optimize processes and increase machine availability at the same time“ |  |
Head of Product Management & Logistics Services | TRUMPF
Update: 06.10.2023
New in Version 2.15:
- Error minimization & security: Input validation
- New DateService
- Location dependent date formatting
- More user-friendly single selection (SingleChoicedirective)
- Additional query job overview

Case Study:
Predictive Maintenance – TRUMPF Lasertechnik
With YUNA, we at TRUMPF Lasertechnik have set up a condition monitoring portal that predicts machine failures and serves as the basis for further functions in the area of predictive maintenance.
Learn more.

Case Study:
Artificial Intelligence for better sales forecasts at SMA Solar Technology AG
With YUNA we have increased the accuracy of sales forecasts by up to 35% - learn more in our case study!

Case Study:
Artificial intelligence in invoice verification
Discover how we, with the help of intelligent algorithms, helped B. Braun Melsungen AG as an accountant to simplify their invoice receipt immensely!

Case Study:
With digital twin and AI to smart services in solar energy
The digital twin as an image of photovoltaic systems and starting point for complex data analyses and starting point for further use cases.
Jump start now – we will walk you through it!