
New YUNA-Release
In a close dialog with our customers and through the experience we gain in our projects, we continuously develop YUNA in short sprints.

New YUNA-Release
In a close dialog with our customers and through the experience we gain in our projects, we continuously develop YUNA in short sprints.
2.15
Error minimization & security: Input validation
With the new input validation, values or inputs and changes made by users are now checked before further processing. Thus, it can be verified directly whether a value input corresponds to the previously defined conditions, for example, whether the value in the DataGrid widget is in a field for percentage inputs between 0 and 100%.
New DateService
The DateService for the use of date formats, was revised, in order to function also in the future still more reliably. Due to this restructuring, previous date formats must be exchanged, insofar as they do not already comply with the Unicode standard now defined as standard.
Examples for new formats:
| Specification | Format | Example |
| short | yyyy-MM-dd | 2016-06-05 |
| long” | yyyy-MM-dd HH:mm:ss.SSS | Englisch:2016-06-05 13:22:24.000
Deutsch:2016-06-05 13:22:24,000 |
| default) | yyyy-MM-dd HH:mm:ss | 2016-06-05 13:22:24 |
Location dependent date formatting
In the “long” format setting, the appropriate localized format is applied depending on the localization of your browser. In case of German localization, German formatting will be chosen. In all other cases, the English one. For more information, see the documentation available in YUNA.
More user-friendly single selection (SingleChoicedirective).
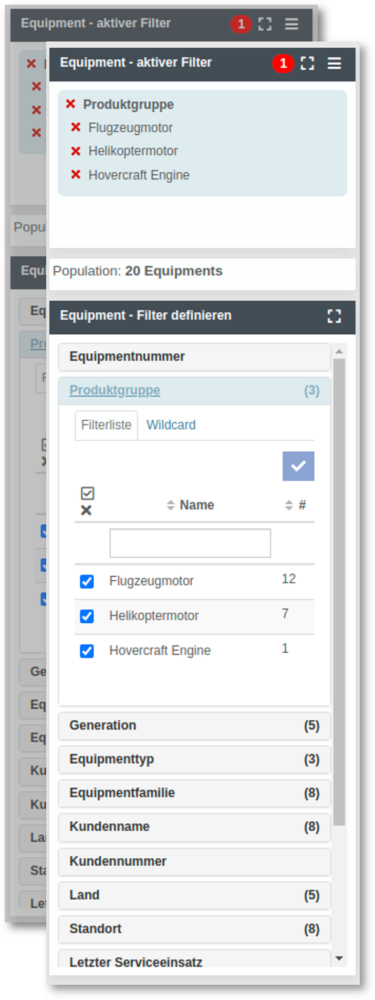
In YUNA, the intelligent filters for a selected unit (e.g. a device) can be displayed, which were previously selected from a list.
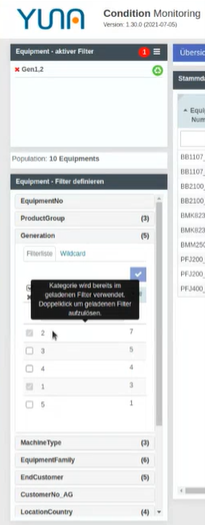
By selecting certain filters, it was previously possible that selected items were not available in the single selection. This was the case, for example, if a filter was called up via a previously saved DeepLink and an element was stored in this filter at the time the DeepLink was created, which is now no longer part of the current filter set. In 2.15, the possibility has now been created to retain the selection in the single selection: In doing so, the filter selection is set to the default filter or the empty filter. However, the option to reset the single selection and apply the loaded filter remains.
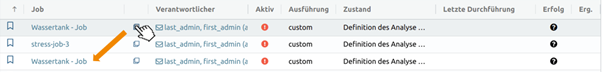
Additional query job overview
In YUNA, scripts provide answers to a wide variety of questions posed by users or enable comprehensive automation of process steps. The combination of question and script, or the intended goal, is called “facts” in the YUNA context. The execution of these scripts can be controlled manually or cyclically in YUNA. This control is called “job” in the YUNA context. In 2.15, when a job is canceled, an additional query is displayed for cross-checking, including a list of the affected job names.
Minor Bugfixes
Several errors in the filters and in the job overview have been fixed. In the filter management, all owners are displayed in the metadata again. Fixed a bug where notifications were sometimes not displayed if their timestamp was identical to those of other notifications.
2.14
Design System
To expand and revise the user interface, the component library, from which dashboards can be developed, is constantly being expanded. The basis for further components has been created
Navigation bar update
Among other things, the navigation bar or sidebar has been updated. It can now be defined more precisely and intuitively, making it easier to navigate through different dashboards. In addition, dashboards or views can be set as favorites and a search function has been added.
2.13
Stability improvement or system hardening
In enterprise-wide use as a central platform for data access, visualization and execution of analyses, it could happen in special exceptional cases that too many parallel queries to the database with high data volumes were started by different users. This could lead to a slowdown of the system. From now on, different values can be limited:
- Maximum number of queries
- Global time limit
- Size of the query queue
In addition, the metrics in Prometheus monitoring have been adjusted accordingly:
- Number of waiting, in execution and blocking queries.
- Current waiting time
- Average values of the last 10/100/1000 queries
- Lifetime statistics
2.12
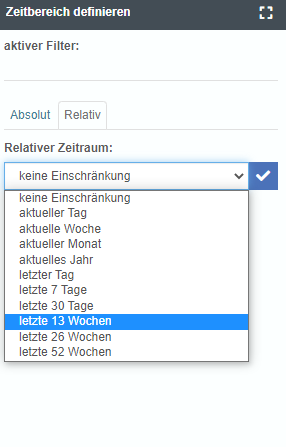
Complete overhaul of the date filter
Continuous improvement on all functions – we have put the date filter back on the drawing board and re-raised it. This has significantly improved the usability. Also, a component of YUNA’s new design system was implemented with the date filter.
Effects of changes on filter definition
In YUNA, individual smart filter sets can be compiled, changed, shared and reused. If the basic definitions of the filters change, this can have different effects. With version 2.12 we have implemented different actions:
- Mistakes are made in categories if the category has been removed from the definition or the filter type has been changed.
- Linked jobs (executions of scripts) are stoppedif faulty filters are used.
- Labeling of relevant filters.
- Users receive a short notification.
2.11
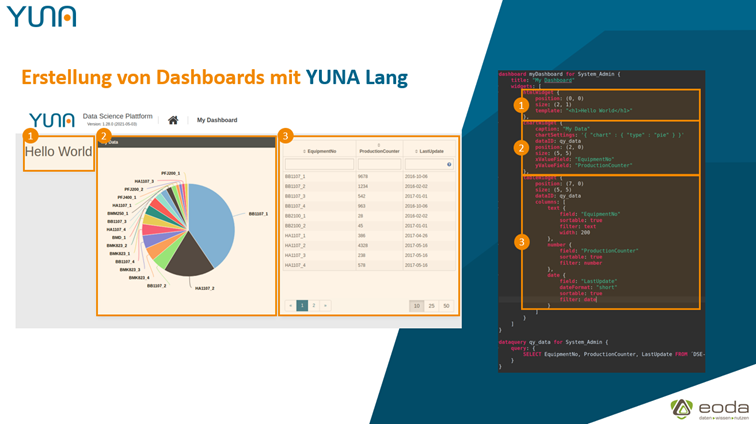
Update of YUNA Lang
YUNA Lang is an XML-oriented syntax that can be used to configure, modify and create dashboards in YUNA. The possibilities for individual customization have been further expanded. Among other things, label types can be defined, timestamps can be formatted or parameters in the HTML widget can be used directly in the template.
2.10
Improved Monitoring
To monitor the system health of YUNA instances, the external tool “Prometheus” is used. In version 2.10, the endpoint that Prometheus and YUNA interact with has been changed so that now jmx, instead of jvm as before, provides metrics.
These differ to some extent in content and naming, but still provide detailed information about the system. In addition, YUNA-specific metrics, such as the number of connected agents, are also exported via the endpoint. One endpoint was removed in this process.
2022
Would you like to know more?
2.9
Test IDs for Automated End-to-End Testing
The automated end-to-end testing of dashboards, for example by Selenium or Playwright, has been further optimized. By introducing fixed IDs in various components, they can now be identified more easily within the HTML structure. The ID assignment of widgets can now also be overridden with fixed values.
2.8
Whether in condition Monitoring & Predictive Maintenance, load forecasts in the energy network or in the Sales Forecast – with quickly comprehensible visualization, insights can be gained more quickly from data and decisions and actions can be derived.
With the new version, we have expanded the visualization options of YUNA. In different diagram options, each with different variants, YUNA simplifies explorative data analysis across a broad spectrum.
Supported chart types:
- Line
- Bar
- Pie
- Scatter
- Boxplot
- Candelstick
- Heatmaps
- Graph
- Tree(map)
- Sunburst
- Sankey
- Funnel
- Gauge
- etc.
Ready-set-go – Now get started with YUNA even faster!
With the experience gained from setting up YUNA for our customers, we have greatly simplified the installation/deployment of YUNA. Even before, YUNA could be deployed via Docker containers in almost any infrastructure – here we have once again made various adjustments and drastically reduced the time from initial deployment to user login. At the same time, the changes mean that YUNA instances and backups can be started up or imported even faster at the push of a button, e.g. in cloud structures. This reduces downtime in productive use for automation and analytics projects – and now allows even more convenient use of test systems.
Out-of-the-box vs Customization? The system panel
With YUNA, we support our customers with a platform that they can customize to meet their needs for implementing data-driven use cases and automating business processes.
The system panel combines various options, settings, the possibility to change permissions and to monitor the system status.
2.7
Improving system performance
With YUNA we give users the possibility to analyze comprehensive data quickly and directly and also to use it for process automation.
To improve system performance, we have created the possibilities to define both a global (i.e. system-wide) and a use-case dependent maximum for data queries. These limits can be configured by administrators. In the spirit of transparency for the user that the result range has been narrowed, this limit is also displayed in the Table and DataGrid widget. In addition, the update pays in preparation for the upcoming implementation of a lazy loading functionality in the DataGrid widget.
Typification of IO channels
Through the IO channels, the individual widgets communicate with each other, i.e. exchange information and react to each other. By introducing the global and user-defined maximum, some changes have also been made to the IO provider:
DataID provider
In YUNA, data from databases and scripts are assigned to a unique ID. It is the link between the widgets – complex processes can be displayed and implemented more easily. In this course there are some breaking changes:
- Output object properties “rows” and “columns” have been removed.
- The data of the output object can now always be found at the “data” property
- If the properties “rows” or “columns” are used in user-defined templates (e.g. in the DataGrid or Form widget), they must be replaced by “data”.
DataGrid widget and HTTP provider
The DataGrid widgt is used to display tables in YUNA. It enables various functions such as export and direct visualization in the form of distinguished charts.
Changes:
- To pass data from the HTTP provider to the DataGridWidget InputChannel “data”, the new OutputChannel “responseBody” must be used.
Form widget
The form widget is used to display forms, or input fields.
Changes:
- The Output Channel now returns the entered data directly as an object
- user-defined templates, which use the form widget output, must now directly access the properties of the object
- Until V2.6: [0]. From V2.7: <ChannelName>.<Property>
Even more secure: Encryption of credentials used in scripts.
To connect third-party systems such as Jira, Microsoft Dynamics, etc., it is often necessary to store access data in scripts. In order to protect these from being viewed by third parties, the corresponding access data is henceforth stored in the database in encrypted form. The decryption, which is only possible within scripts and thus never leaves YUNA, is done using the individual key of the respective YUNA server.
Optimization of the tracking of faulty and aborted analyses.
If analysis executions are aborted in YUNA, e.g. due to technical problems or due to incorrectly selected parameters, temporary data is always stored for later tracking in order to better analyze potential errors. Over time, however, this data can lead to greater memory consumption on the executing system.
To keep the system permanently clean, this data is stored with the new version in the operating system’s temporary directory so that the operating system’s comprehensive memory management mechanisms can be used to clean up the temporary files.
Continuous improvement: Smart logging
System logs are often confusing, long text files. Basically, there is always the conflict between completeness and clarity with log files. While there used to be numerous errors in YUNA, which were mostly classified as ERROR regardless of criticality, we have now given users the option to choose different log levels:
- ERROR: All errors that can affect the operation of YUNA.
- WARN: Other errors, e.g. due to operation
- INFO: Other outputs
- DEBUG: Test outputs
This way users can directly see if a reported discrepancy requires an administrative action or if it should just be a hint. In addition, different log files can be created for different user groups, which leads to faster error identification.
2.5
Even more secure deployment of dashboards
With YUNA Lang as markup language it is possible to develop own dashboards in YUNA or to adapt existing ones. With the new version, we have further improved the VSCode extension so that YUNA Lang now officially has the status “Ready for Production”. New features include the following:
- Passwords required for deployment can now be stored in a password store per project. This means that they no longer have to be re-entered for each deployment process.
In addition, the project structure is ensured via a separate project file when changing / creating the dashboards. Thus, for example, it can be ensured that the correct folder was selected when opening a project. - Another new feature is the automatic version comparison between the YUNA Lang extension for VSCode and the YUNA instance. This ensures the compatibility of dashboards across different instances
- In addition, standards for deployment profiles and RefTags can now be defined within dashboard projects, making the deployment process even easier and faster. RefTags are used to jump between different dashboards and dashboard chains (i.e., related individual dashboards), which can be enormously handy especially when testing newly created dashboard views when they are to be made available to individual users first.
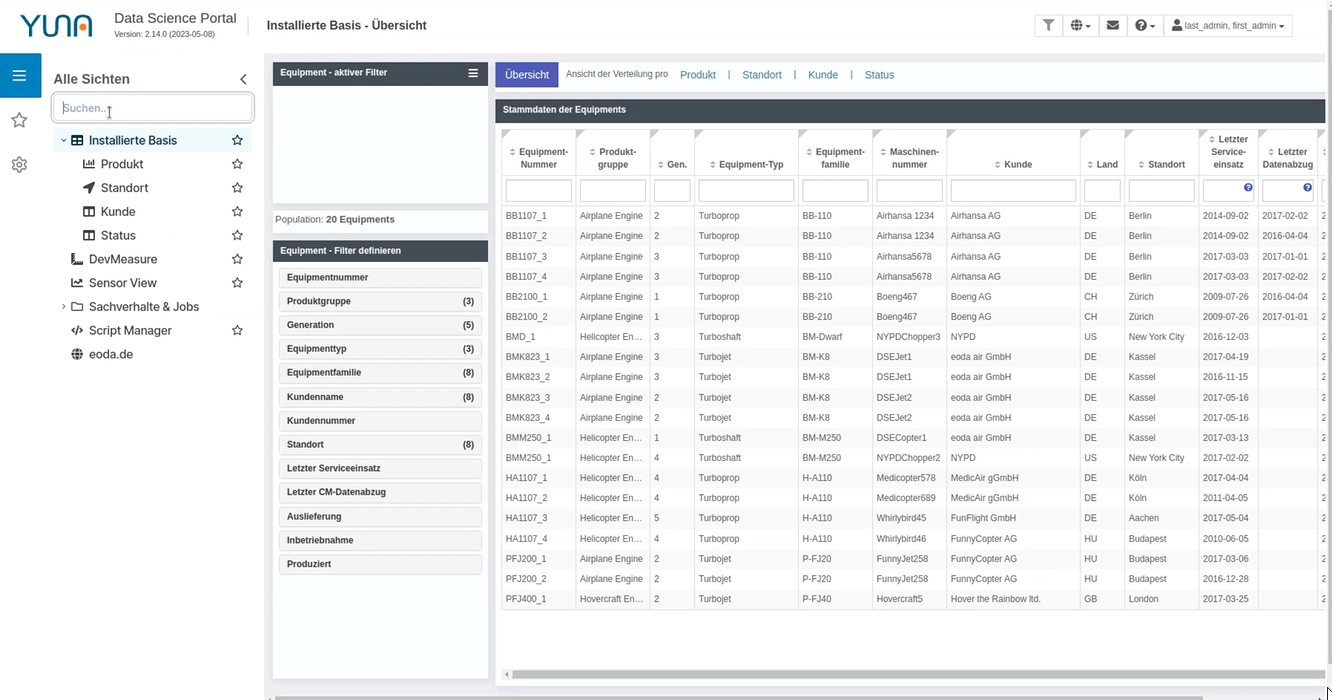
Grouping table columns in the DataGrid widget
With large tables, the overview can quickly suffer. However, a special focus of YUNA is to make it as easy as possible for users to get an overview when working with a lot of information and data.
In version 2.5 the DataGrid widget, which is used to display tables, gets the possibility to group columns that belong together, e.g. thematically. In addition, these grouped columns can be expanded or collapsed, so that you always have as much information in view as you need at the moment.
2.4
Simply extend existing data sets
Imported data sets for further processing often have a disadvantage in common BI and analysis tools : they are rigid and almost unchangeable. It is often difficult to add updates or new information. And if they are, the updated records are stored as a separate copy to be merged with the original record. In YUNA, data records are virtually mirrored and can be extended by manual entries, similar to versioning:
- Option A: Contents of existing cells can be changed. The changes are updated in the corresponding record.
- Option B: Enter new information by adding additional columns.
The new function opens up further possibilities in addition to the actual input of new values: For example, the data in the tables can be labeled or annotated by an additional column.
Through the internal filter logic [LINK] in YUNA, these data sets can then be used directly in the Workflow Manager for new analysis models or are used in existing models.
Übersichtliche Tabellen
In YUNA, different locations / teams but also individual people can collaborate on the same database. For this purpose, YUNA offers different language variants. In the new version we have extended the internal translation logics.
Thus, filter sets [LINK], which are created by the users themselves, can now also be provided with corresponding translations. This way, not only newly created filters, but also existing filters for other languages can be displayed in a meaningful way.
Automated deployment & delivery of YUNA Lang
With YUNA Lang, dashboards can not only be created in YUNA, but also existing dashboards can be customized. There are two different ways to do this:
- Users with appropriate rights/roles create their own dashboards. And can roll them out accordingly.
- Dashboards are created/modified by admins company-wide or for specific groups.
A VS code extension has been made available for the former case. With this tool, all other existing VSCode extensions are also taken over during deployment.
For the second way, a corresponding CLI tool has been created, which simplifies the automated rollout of dashboards.
2.3
Bugfixing
2.2
Function update of the Imageviewer
With the Imageviewer you can display images from the database in YUNA. Newly added is the possibility to create a direct association of the images with the information from the tables.
Update to full screen mode
The full screen mode is now available for all widgets in YUNA.
2.1
More information about YUNA-Filter viewable
The filter system is an elementary part of YUNA and goes far beyond the common understanding of sorting/hiding information as known from Excel or in online stores.
The filters in YUNA “communicate” with the dashboards, they keep their settings even when switching to other views/dashboards – so you don’t have to select the same categories every time you want a different perspective. Also, the filters can be linked, changed and saved, as well as further customized via “wildcards” i.e. placeholders.
Also, these saved “filter sets” can be easily shared with others or used directly in the creation of new dashboards or even the development of entirely new services. So from a classic BI view, the filter can be used to design a new use case if, for example, a different analytics model is to be used – shortening the development time of individual use cases.
For clarity, we have opened the API that manages the YUNA filters. All information used in the respective filter can now be viewed directly.
Duplicate jobs
YUNA enables users not only to quickly grasp information through visualizations, but also to execute and manage the underlying models without relying on a data science background. This execution (cyclic or manual) is controlled via jobs. Along the workflow, jobs contain information such as specific parameters, execution times, responsibilities and filters.
With version 2.1 it is now possible to duplicate jobs very easily. This allows you to quickly create new jobs or quickly adapt them for new/different use cases. At the same time, we have extended the job overview so that the corresponding phase of the workflow in which the individual jobs are located is displayed there by default.
Major Update – 2.0
With the new version, all internal as well as external structures are now based on Java 11. In the course of this major update, many changes have occurred “under the hood”.
We have used the opportunity to optimize YUNA even further. For example, the internal structure is now even more intuitively divided between backend and frontend, and various packages such as OSGI, jettys and JAX-RS have also received upgrades. In the course of this restructuring, we also immediately paved the way for further comprehensive changes – allowing us to implement our vision of YUNA even faster.
Currently we are working on
- A complete redesign of the user interface.
- New convenience features, for the end user.
- More detailed and automated visualization options.
- Even more possibilities to let YUNA interact with different applications.
- Connection and integration of external applications.
We are looking forward to the future and the new possibilities to transform data-driven intelligence, competence and decisions even better into tangible added value!
1.35
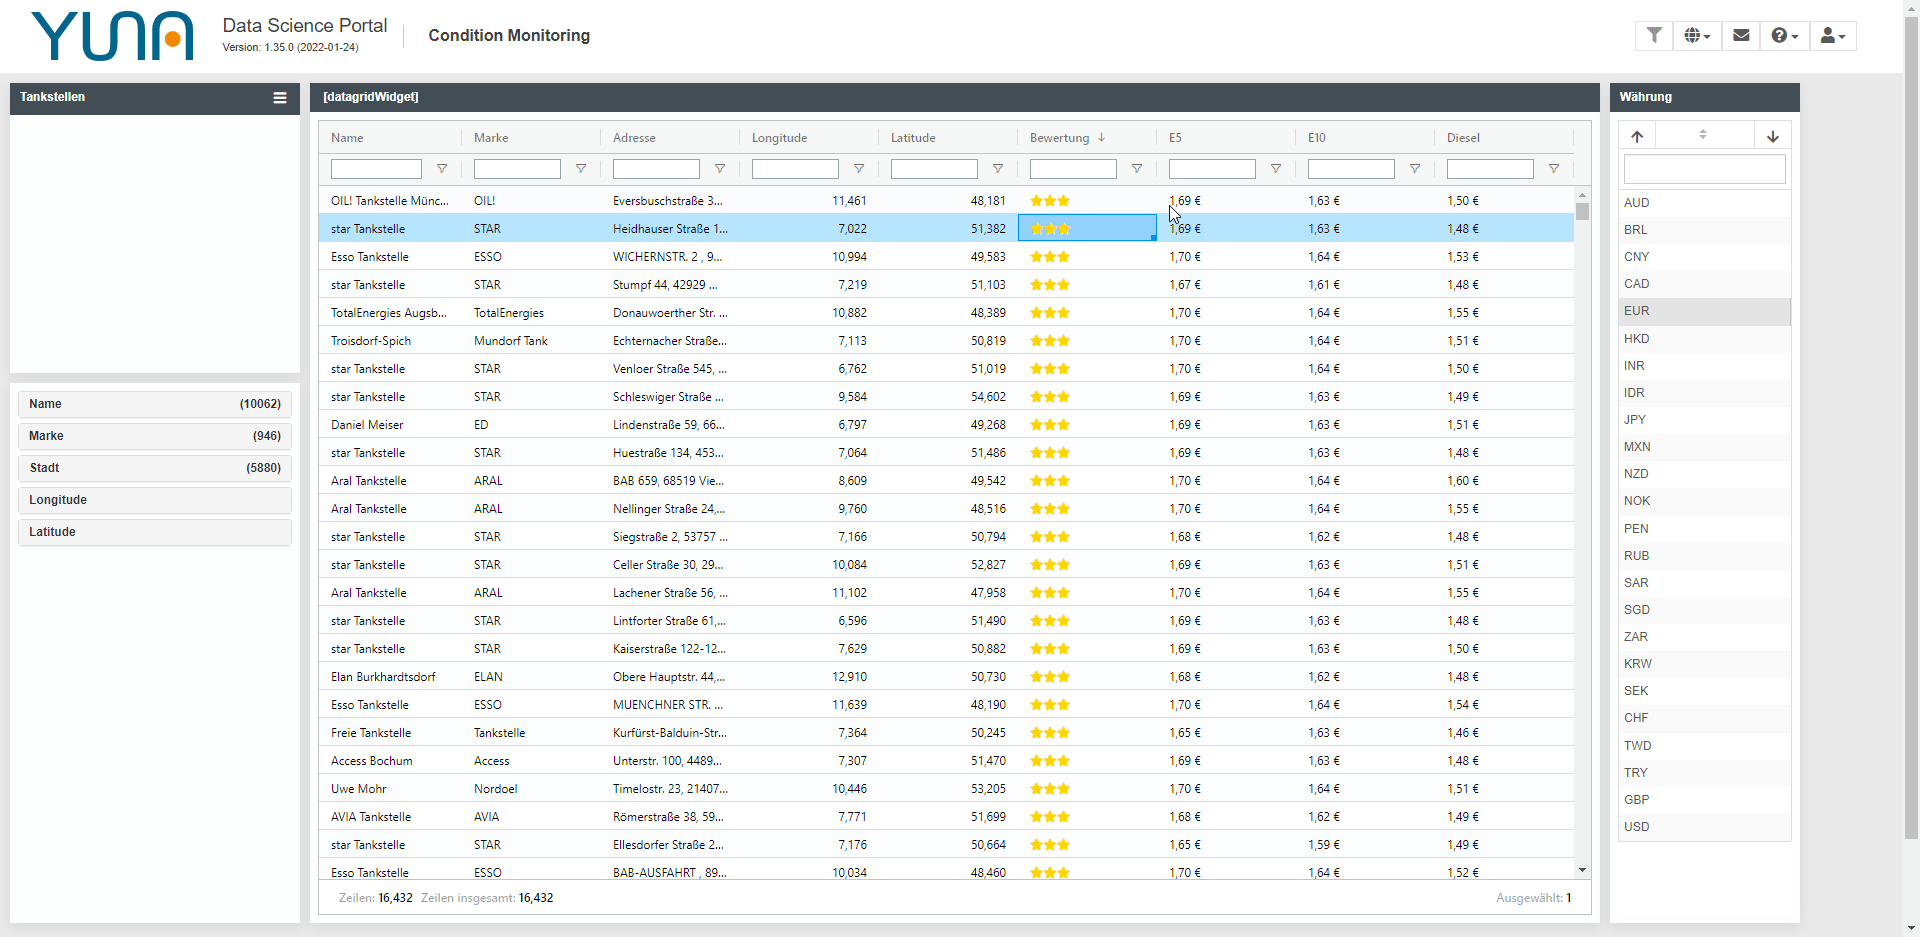
DataGrid – the better table
In the new version we have introduced the DataGrid Widget, the successor of the Table Widget. In addition to significant performance improvements in the dynamic display of large data sets, the DataGrid Widget brings the foundation for a variety of exciting new features to the application:
- Interaction
Integrated full-text search in the respective columns
Improved interaction with other widgets, e.g. various formatting and functions can be changed e.g. by filter widgets. - Extended filters
The mapped data can now be filtered and narrowed down using comparison operators (equals, lower than, higher than, in range etc.). - Clearer
Combination of different master data e.g. from different database columns in a single column
Columns can be changed in their width as desired
Quicker recognition of correlations – Integrated Charts
The new DataGrid also offers the possibility to visualize data directly from the table! To do this, simply select the desired cells, then right-click to choose a suitable chart type, which can also be modified afterwards. Accordingly, progressions but also correlations can be recognized even faster – of course, these diagrams can then be shared again with other YUNA users or exported.
More:
- Columns freely definable (move, change column width, hide, pin, auto-size)
- Infinite scrolling instead of pagination
- Simple conversion like e.g. exchange rates directly in the table instead of using StoredProcedures
- Cell selection (Single & Multi)
- Export of selected cells (CSV, Excel etc.)
- Aggregation of selected cells (sum, average etc.)
A simple example:
To display the worldwide machine status of each machine with associated total costs in a condition monitoring portal, all relevant functions such as location (via GPS coordinates and contact addresses) and machine generation can be displayed in the table. Using YUNA, additional information such as machine configuration can now be displayed in a new column directly in the table via a filter widget. The total costs, can then even be changed in different currencies on a daily basis (the calculation is automatically performed in the table), which simplifies international communication.
Automatic assignment of pre-filters
Prefilters are collections of certain filters, which, for example, narrow down the database to the data relevant for the corresponding groups – without setting up separate data pots.
From now on, the various individual pre-filters will be automatically assigned to the corresponding users.
2021
Would you like to know more?
1.33
Simplified installation – YUNA now available as container images
Implementing an enterprise data science platform can be a laborious process – at least it has been in the past.
To enable YUNA to be deployed even faster now, we are now making YUNA available for the first time as container images, which include frontend server containers, backend containers, agents as well as liquibase and can be deployed including nginx in a Docker compose file. This is the first step towards significantly accelerating the setup process of the entire platform in the future and making it even more convenient, so that YUNA will soon be even easier to integrate into existing structures.
Favorite mode – get there faster
Different use cases, different scripts and a multitude of different analysis jobs – the overview can sometimes get lost.
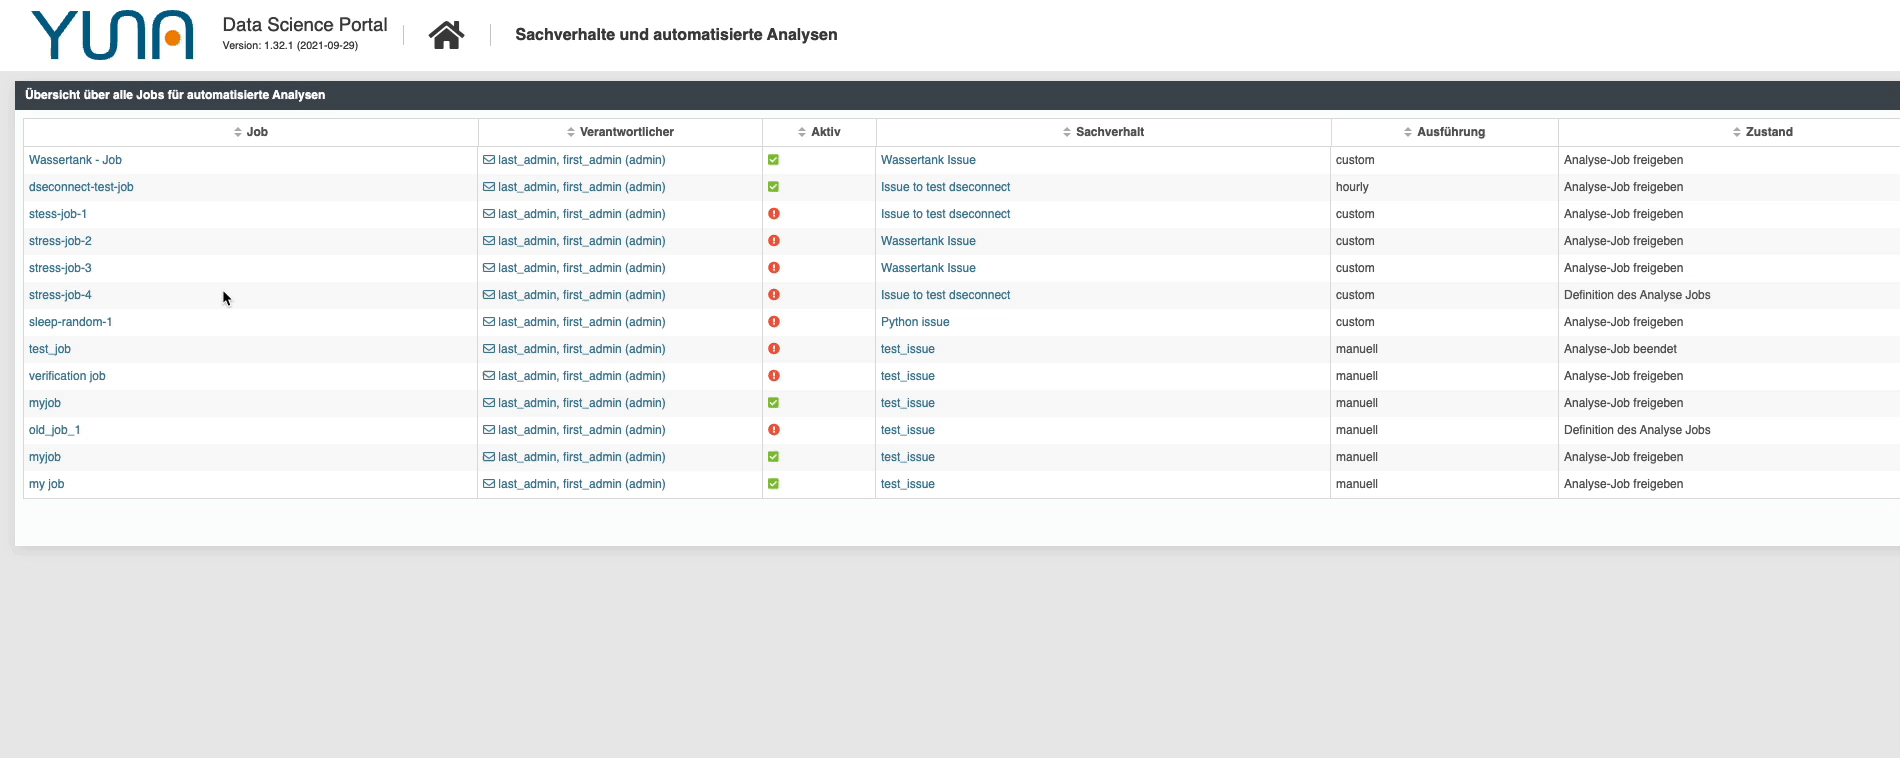
| For this reason we have integrated a favorites functionality in the new version. Similar to bookmarks in a browser, the desired use cases, jobs and even views can now be marked and found again more quickly later. In addition, these favorites can of course be searched and sorted again – in case the number of favorites also gets out of hand.
But we go one step further: Any data can be saved, whole (filtered) tables and the favorites can also be used in existing tables. |
 |
Usability: make (active) settings clear!
When cells in Excel are filtered in a certain way, this is often only indicated with small icons – the situation is similar for popular business intelligence and analytics tools: Active settings, e.g. of filters, are often visualized for the user only very sparsely and not very transparently.
| With the new version, we have now highlighted active filter settings in color: This shows even more clearly whether appropriate settings have been selected at all, and which categories are responsible for narrowing down the number of choices of other filter categories. A colored distinction is made between loaded, i.e. already defined filters, and additional filter selections made by the user.
The result: users can now see directly where which settings are active – due to the fact that entire views can be split in YUNA, the different users can now understand even faster what exactly they are seeing! |
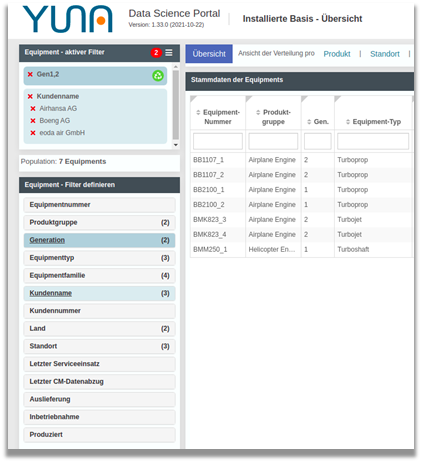 |
Numeric table columns – update
Numeric table columns are needed for many different data: Financial values in different currencies, size ratios in percentages, etc. In addition, different number formats or number groupings are needed depending on the language or region.
With version 1.33 we have completely revised the formatting of numeric table columns. Numeric values can now be configured extensively to display data contextually and support different languages even better.
1.32
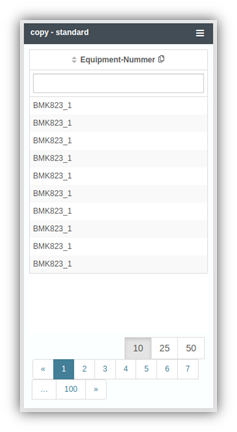
Easier copying of raw data from table columns
| User feedback is important when it comes to application usability – YUNA is no different. From this feedback, a new feature has emerged: Instead of exporting table contents and copying them from there and reusing them elsewhere, this can now be done by clicking on the copy icon. This saves the entire content of the column to the clipboard. Depending on the configuration of the dashboard, all or only unique values will be copied. Active filters in the table widget as well as the selected sorting will also be copied in addition. |
 |
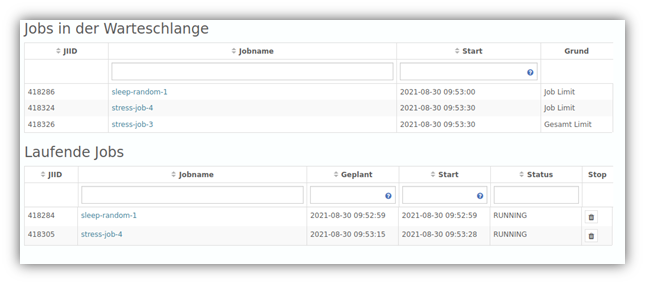
Better management of analysis jobs
| Companies that work intensively with and analyze large amounts of data know that analyses can become so computationally intensive that the hardware used quickly reaches its limits, resulting in a system crash in the worst case. In version 1.32 we have further adapted the job management: If the defined number of running jobs OR the number of running instances per job (i.e. parallel YUNA instances) is exceeded, newly added jobs will from now on land in a queue and will be executed as soon as sufficient capacities are available again. The corresponding widget has been revised and now displays the corresponding queue information in detail, making the process transparent to the user, who can also understand why certain jobs have not yet been executed. |
 |
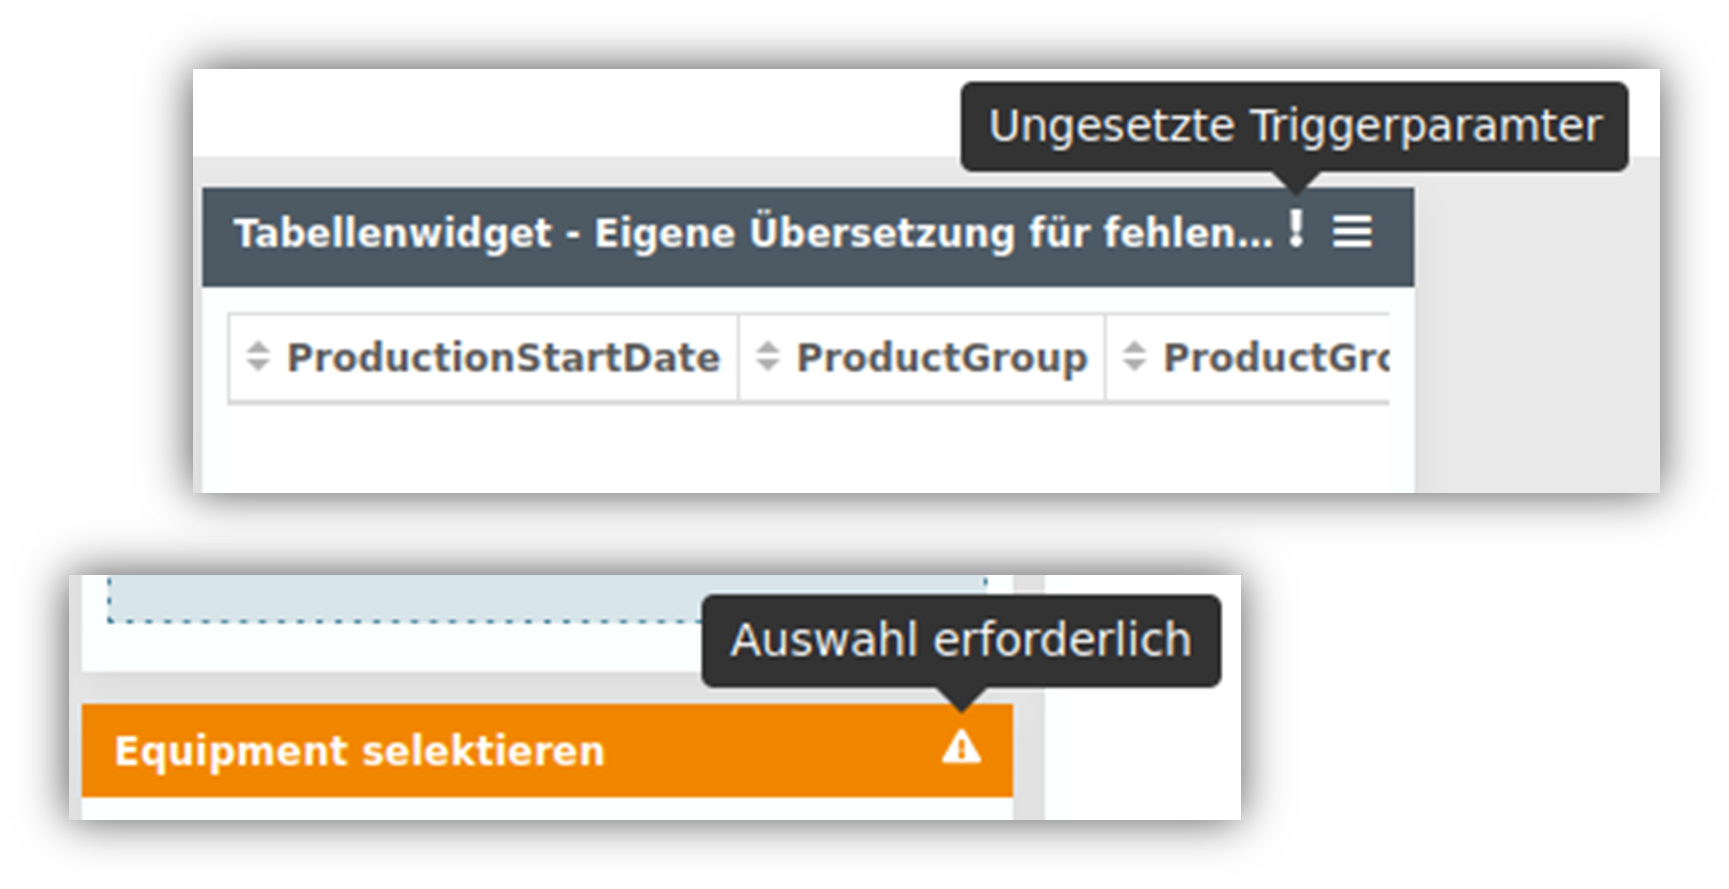
Notice of missing selection in widgets
| When presenting information, flexibility and showing context are critical factors. Accordingly, widgets in YUNA can react to each other and the input of one, for example, changes the display in another. However, it can happen that a user overlooks at which point a selection has to be made in order to get data displayed at another point. For this problem there is now a solution: Widgets, which require an input by the user, are now additionally marked in color in YUNA until a corresponding selection of entries has been made. On the other side, i.e. in the widget in which, for example, a display is to take place, a note is also displayed that a selection of data must first be made elsewhere for the display. The corresponding notes can of course be customized individually for each widget, if different hint texts are to appear on different dashboards. |
 |
1.31
Usability update for filters
For categories filters, now let you select the entire range between two different values with a keystroke.
1.30
Turning data analysis into action faster
A script alone does not make a commercial success – there are several factors that need to be considered – organizational as well as technical and these multiply with the number of scripts or analyses to be performed.
With the new version, we have eliminated various steps so that analyses can be put into production more quickly.
For example, changes are applied directly when an analysis job is created and no longer need to be confirmed. Also, it is no longer mandatory to leave a comment when switching between the individual steps of the workflow. However, this possibility has not been completely eliminated, but is offered as an optional function through an additional button. To guarantee tracking, all process steps are still logged.
While it was previously important to confirm each step in productive environments, it is now possible to implement the release (and thus the actual execution) with just one click. This allows experienced users to reach their goal with significantly fewer clicks and to go through the job manager in just three steps.
More usability features
| A new addition is a search field within the displayed tables. As a result, this simplifies the application in that the search function is permanently accessible and no longer needs to be accessed via a context menu.
Furthermore, we have extended the use of saved filter sets. If a saved filter is loaded to narrow down the displayed results, filter criteria defined in the filter and thus locked can be resolved even faster to make adjustments. The user is informed of this new option by a tool tip when hovering over a grayed-out filter criterion. If, for example, the user wants to use the categories defined in the loaded filter to create a new filter set, the filter can be “unlocked” by double-clicking on it, so that new filter sets can be easily created. The result: for comprehensive analyses, predefined filters can be used to prepare representations tailored for business users and yet modified by the users themselves according to their ideas and requirements. |
 |
Dashboarding Revamped
One of the core features of YUNA is custom dashboard creation. YUNA does not ship rigid interfaces, but offers users the ability to customize them to their own requirements – both visually and functionally. Unlike other solutions, the elements in YUNA dashboards also have exploratory and not just display functions.
In addition, the dashboard elements are based on the rights-role concept. A single dashboard can therefore take on a different display form depending on the user group – tailored precisely to the respective needs and without having to set up separate or even exclusive dashboards for each group.
For full customization, YUNA uses a modified DSL (Domain Specific Language) called “YUNA Lang”, which is optimized for dashboard creation and offers countless convenience features. With it, dashboards can be created quickly and with little effort on the one hand, and defined with pixel precision on the other. A customized interface almost as fast as off-the-shelf.
With 1.30, YUNA Lang replaces the previously used YUNAML. This makes the creation of dashboards even easier. If desired, the individual components can be configured via code and then rolled out on the corresponding YUNA instances – afterwards, the rights role management takes over the display of the dashboard components.
1.29
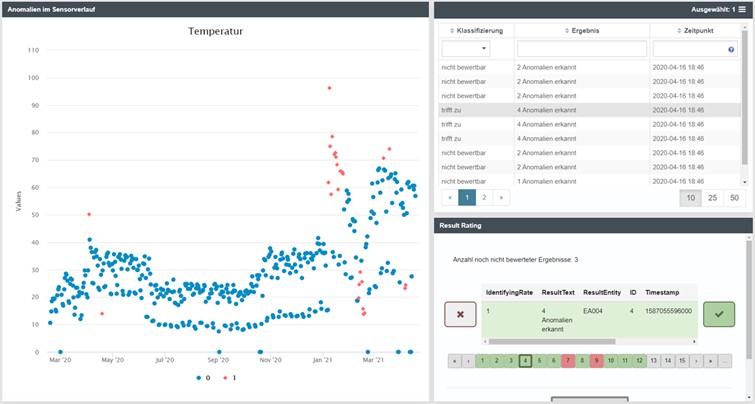
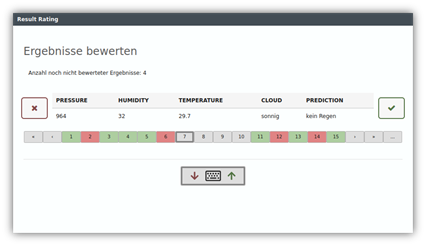
Result Rating: continuously improving AI models
At the core of any AI system is a model. In order for this to achieve the desired results (such as reliable forecasts) on an ongoing basis, it must not only be fed with prepared data in advance, but also continuously provided with feedback on the output results. This is exactly where Result Rating comes into play. Wherever analysis results are presented, the expert can now also evaluate them in terms of plausibility. All that is needed to continuously optimize the model is a simple “true” or “false” evaluation of the individual results.
In order to further improve the intuitiveness and convenience of this function, the prerequisites have now been created to couple the result rating widget with other widgets such as a table or chart widget. This means that from now on, the respective table entries, graphs and ratings no longer have to be selected separately, which has significantly reduced the number of clicks required for navigation. In addition, even filter settings and sorting are transferred to the rating options available for selection, so that manual matching of the results to the associated ratings based on numbering is no longer necessary.
1.28
Filter presets – Relevant from the start
YUNA filters are based on the rights/roles concept just like dashboard elements. This means that dashboards can be set up precisely so that users see exactly what is relevant to them.
The filters can also be saved and shared with other users and teams, so they don’t have to be configured from scratch each time. The time saved can then be used for further analysis or the development of new questions.
In YUNA, a distinction is made between two filter systems – the classic filters and the prefilters. Classic filters work the way you know them from everywhere: they are applied to the particular dataset in the dashboards.
[lyte id=’Gs0L1AjPnec’ /]
Pre-filters are a kind of filter preset – they can be configured in advance and are assigned to specific groups. In this way, the dataset is already narrowed down at the beginning to a certain type, for example, to certain machine models or sales channels. A new feature is that several filters can now be combined into a pre-filter using an OR operation.
Prefilters can now also be created and updated via REST API.
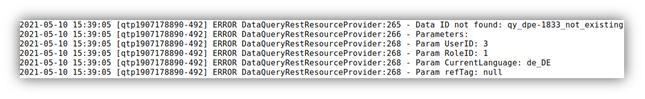
Quickly fix errors – update server log
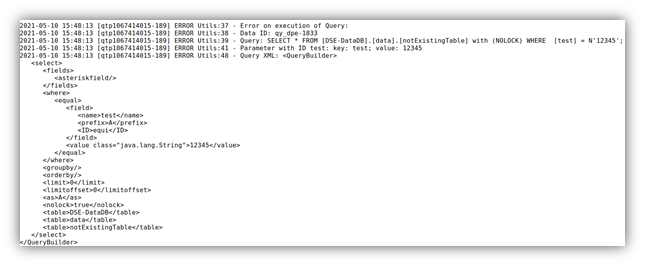
DataID can be used not only to reference individual objects and entire queries from the database – it can be used to create dashboards faster and use YUNA features even easier.
In the new version, we’ve tweaked the server log: now users get detailed information in the log when a DataID doesn’t exist or is incorrect:
 |
 |
1.27
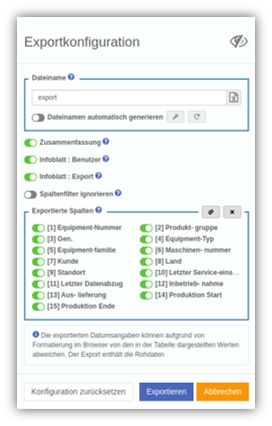
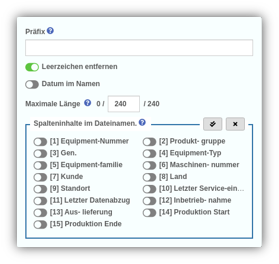
Tables export – new features!
| YUNA offers many features to simplify users’ work with each other. Views and filters, as well as entire dashboards, can be shared via link – allowing users to directly take information from colleagues. Also via API, YUNA can feed this information directly into other applications.
Still, occasionally you need to export tables to use their data in other applications. With the new version, we have greatly simplified the export process and made it clearer and more unambiguous. The UX has been improved once again, so that you can reach your goal with much fewer clicks. File names can now be generated automatically and individually – date, column contents, prefix etc. can be included in the naming with minimal effort. As usual with YUNA, the selected configurations can be saved and shared with others. |
  |
Where is what? The dashboard overview
| To allow users to create their own dashboards in YUNA is one of the basic principles of YUNA – to help you still keep track of everything, we created a new widget: The Dashboard Overview. Here, individual users can view all available dashboards under the current reference tag.
The reference tags – simply put collections of related dashboards and allows to easily switch between individual dashboards e.g. between different use cases
|
 |
The desire to forget – or remember: “Stay logged in”
So that users do not have to log in every time, there are RememberMe cookies. Often these cookies are active all the time or deactivate after a session.
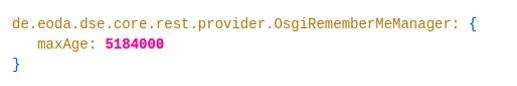
This period can now be configured individually in YUNA – 30 days is set by default. For example, it can be used to identify whether a user is still active.
1.26
YUNA becomes even more secure
The functional core of YUNA, our CORE API, has been hardened even further. As of now, all roles, with the exception of system admins, have read-only permission. This way, all processes can still be viewed at the same time, but are protected from changes.
The CORE API controls all central processes in YUNA. It can be used to control the individual modules such as user management, analysis jobs, the event triggers and authentications.
YUNA gets simpler
In the new version, we have simplified the script manager, among other things. Analysis scripts can now be filtered by the names. Furthermore, the YUNA standard filters are no longer displayed in a resolved way, which makes the overview much slimmer.
For the “GenLinks” function, there is now a dedicated option whether these links should be opened in a new tab or the current window.
Data Scientists and Users Move Even Closer Together
The stage is set for the new Messenger feature. Not only can it be used to receive system messages, users can also send information directly to each other as a message within YUNA. This eliminates the need to switch to third-party applications to exchange and/or share information.
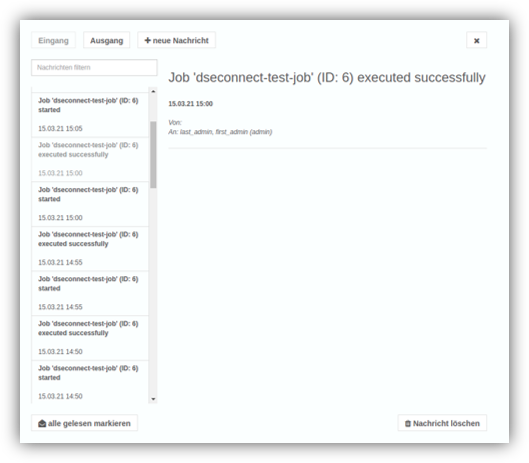
In the current version, the interface is already implemented and can be enabled in the configuration file.
1.25
Training models on the fly
Generating training data has been a major challenge until today. With YUNA, this is now done on the fly. In each dashboard, the Result Rating can be included directly. Thus, the user has the possibility to generate training data by rating the results on the spot of the result presentation. Their results improve significantly due to the better data basis when they revisit it in Supervised Models.
Staging and Model Deployment via Git Branches
Automated deployment of analysis scripts is realized in YUNA with an attached Git repository. Now it is possible to define a specific branch. Thus, different stages (development, test, productive) or the deployment of different models on different YUNA instances can be realized via the different branches.
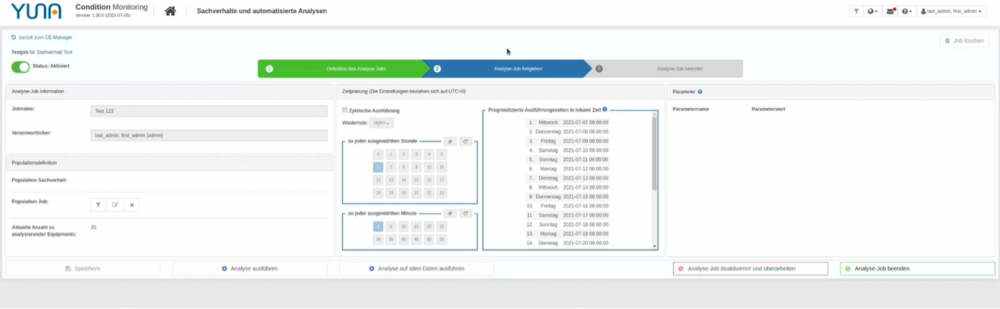
Better planning: always keep analytics in mind
What happened to my analysis that was supposed to start at 11:00? Why can’t I find myself in the log? We have answered these and other questions with a new convenience feature. In complex contexts, analysis jobs can start at different times than originally planned, for example, due to dependencies on other jobs.
In the new version, the system overview now shows the scheduled as well as the actual start of each analysis job, thus allowing to better plan the maintenance of the YUNA instance.
1.24
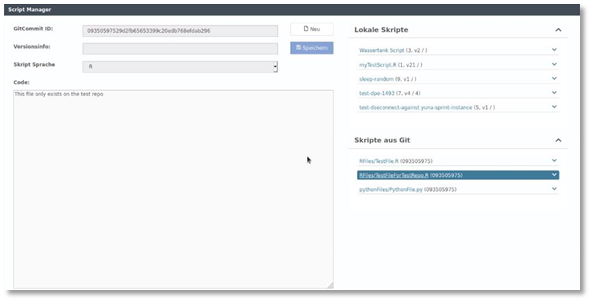
YUNA meets Git: Synchronize Git Repo with YUNA
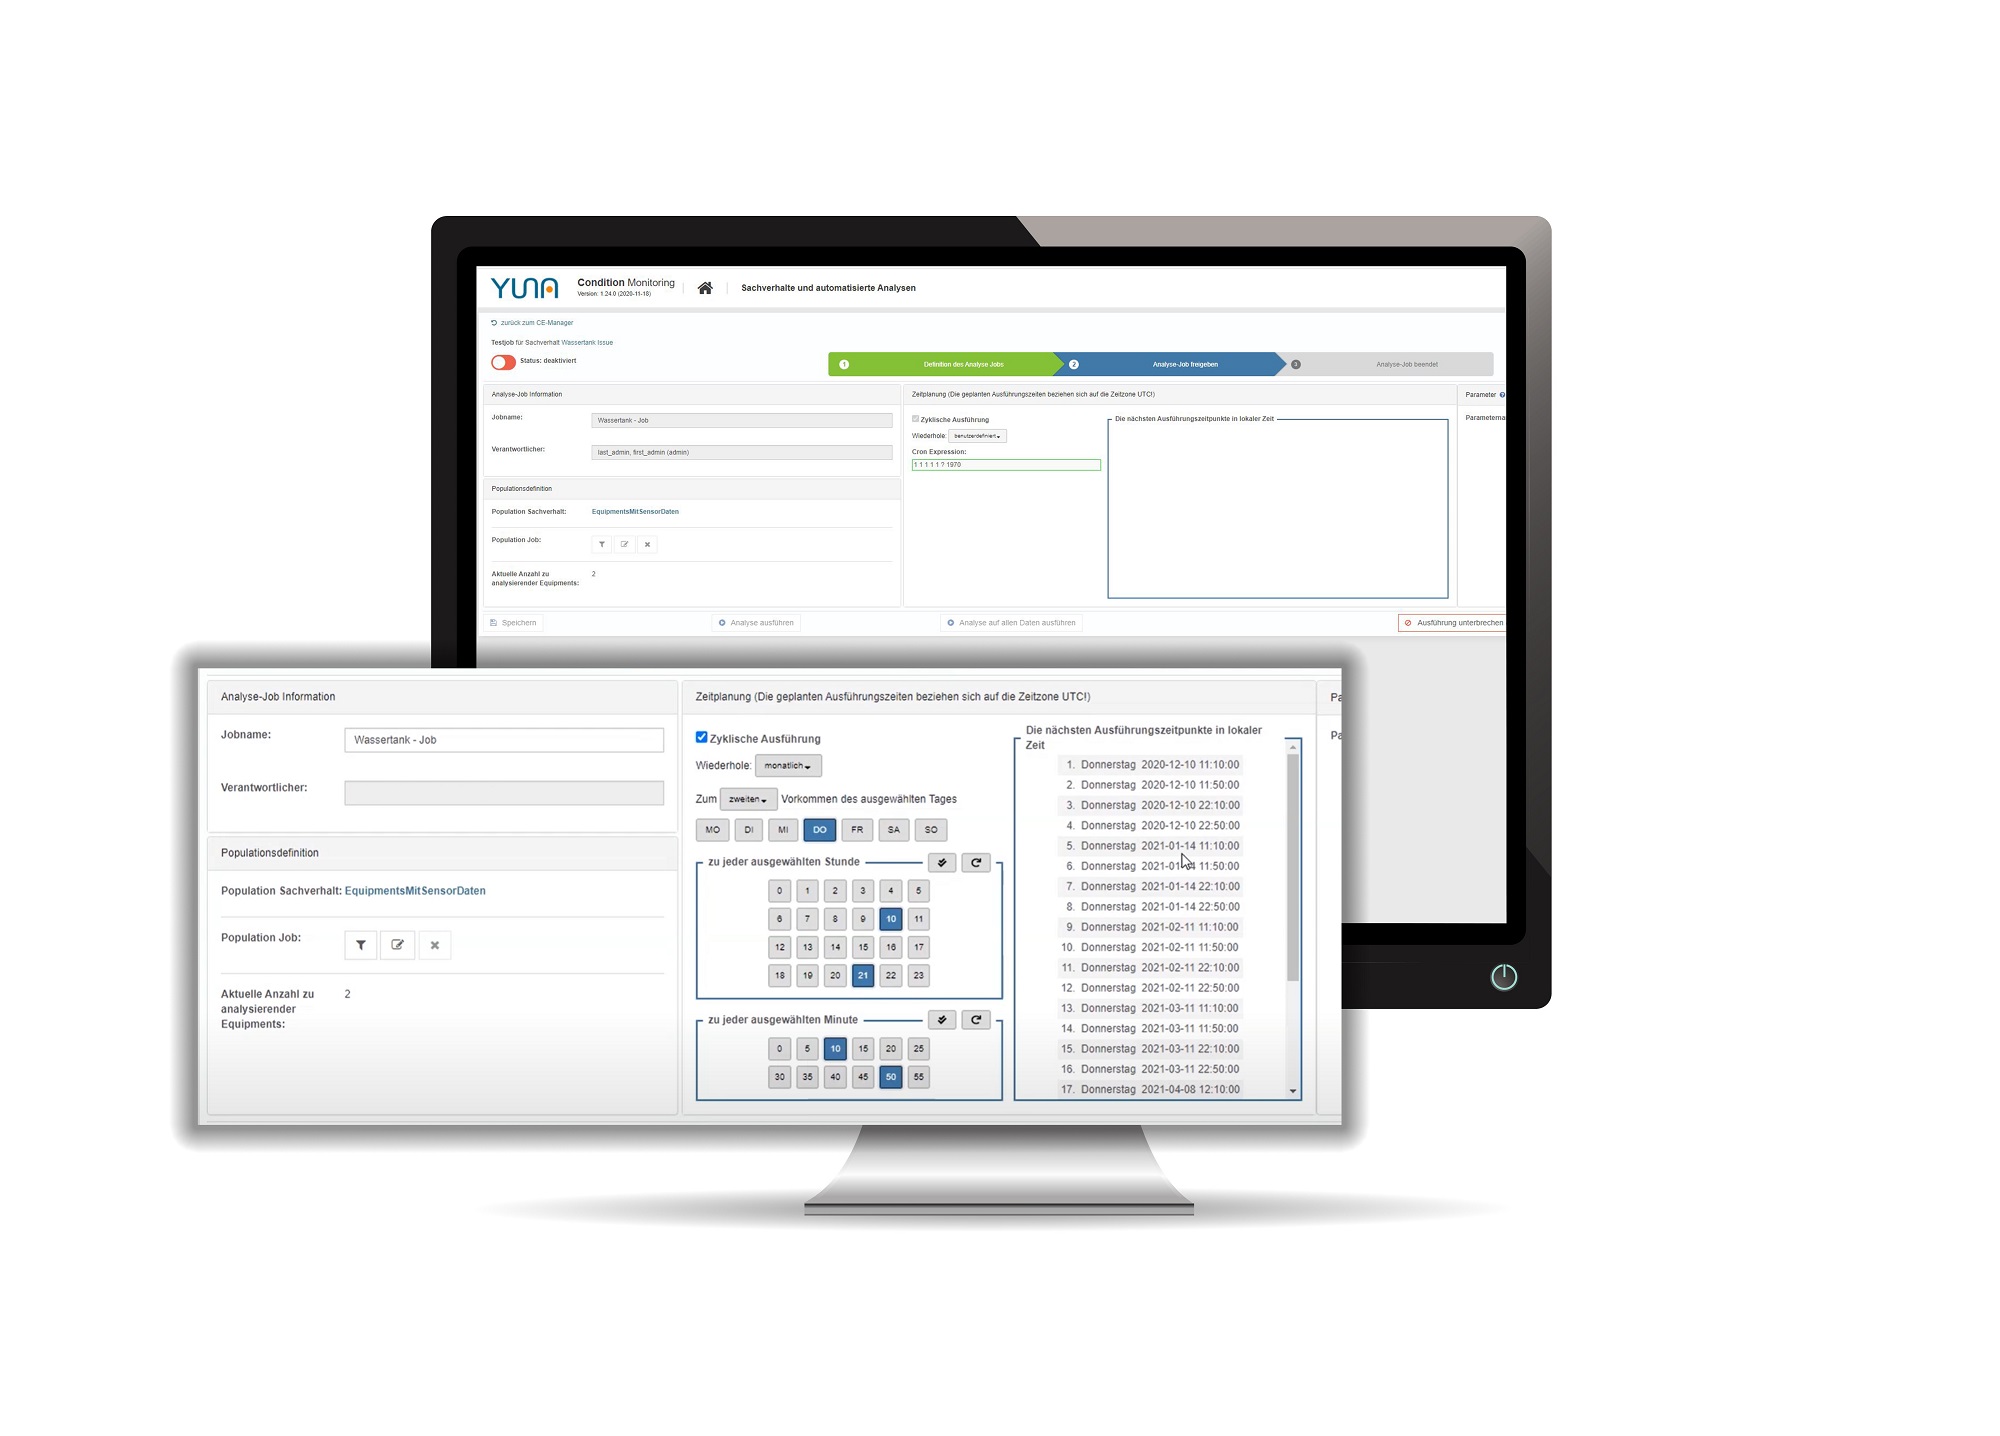
Scripts for productive analysis jobs are managed by YUNA. Whether for ETL, data preparation, ML models or visualizations: Adjustments to the scripts as well as their results – for example through input from business users or end users – should be traceable at any time through good documentation. As of YUNA 1.24, it is now possible to connect a Git repository and synchronize it with YUNA.
![]()
YUNA users can thus – depending on their authorization level – access the Git repo of the data scientists and deploy scripts for the respective phases of a workflow from development to test to productive. Git integration in YUNA makes sophisticated data science script deployment scenarios less error-prone and much easier and faster to implement.
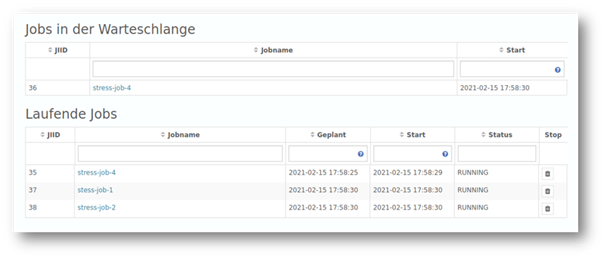
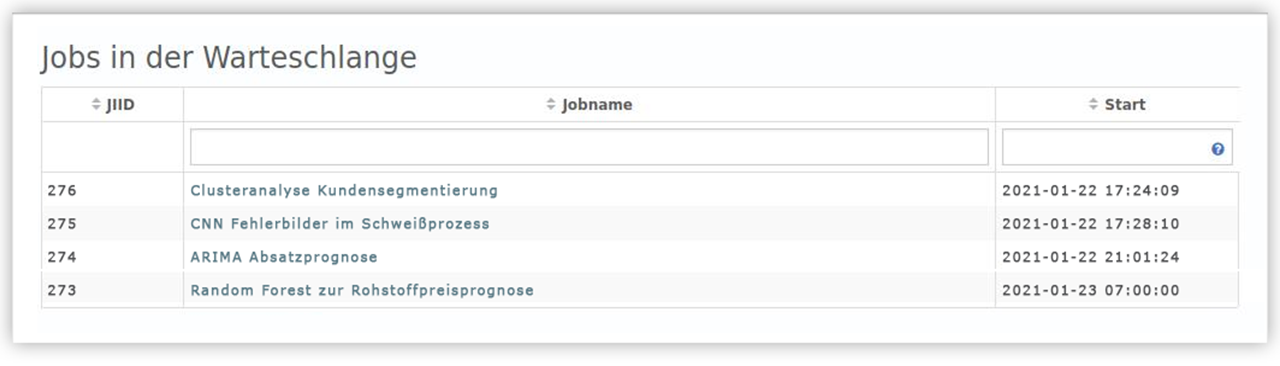
Overview of waiting analysis jobs
In YUNA, the user can time the execution of each analysis in analysis jobs. In doing so, YUNA automatically controls the ranking of each script in a schedule. As of YUNA 1.24, the exact start time of a queued job is displayed. By improving traceability, the update or restart of a YUNA instance, for example, can be better planned without interrupting the run of a relevant analysis job as a result.
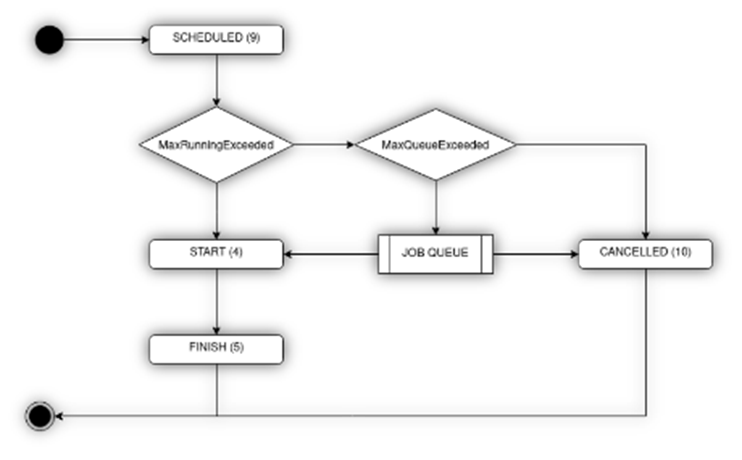
Job status for easier debuggingAn analysis job goes through different phases such as SCHEDULED, START, FINISHED, CANCELLED in its possibly cyclically repeating life cycle. YUNA 1.24 now displays the phase a job is in at any time. This simplifies debugging and debugging a script during the development of an analysis. |
 |
Automatic script log cleanup
YUNA provides the ability to define optional cyclic routines for the system in the system settings. These have been extended in YUNA 1.24 with an additional action that allows the administrator to clean up the generated logs of analysis scripts in a defined time window. Thus, system resources are conserved and the overview is increased.
Simplified dashboard development with YUNA-ML
In YUNA, a dashboard is defined by YUNA’s own description language, YUNA-ML, which is based on XML. For publishing, the respective script is parsed, validated and the result is finally logged. Logging has now been reworked and made clearer to simplify dashboard development.
Releases from the year 2020
Show me!
1.23
Automatic emptying of log entries
YUNA offers comprehensive logging of the analysis jobs. During operation, numerous log entries can come together. Now a selectable period of time can be set after which log entries are automatically deleted – so these entries do not take over and the overview is not lost.
Recall job parameters of an instance
In the new version all relevant information of a YUNA instance can be displayed directly in the database. Of course, you can also display this information directly in a YUNA dashboard using the table widget.
“YUNA Support” entry configuration
You can configure the visibility of the support entry for non-administrators by making a corresponding change.
1.22
Simplified scheduling of analyses
| In this release we have simplified the cyclic execution of analysis scripts considerably.
What exactly has changed? The timing of analyses can now be arranged intuitively to desired cycles. For example, recurring maintenance windows and other events can be scheduled right from the start, so that they no longer collide with important tasks |
 |
1.21
A new image viewer
We have completely revised the widget “Imageviewer” in YUNA. With the widget, images stored in databases can be displayed directly in YUNA. The images can be photographs or automated visualizations of analyses, for example. In addition to the reworked user interface, the Imageviewer has other helpful features.
Multiple maintenance windows
During maintenance, e.g. in the context of a predictive maintenance system, it is necessary that already planned analysis jobs (e.g. analysis scripts to be executed) are stopped by the planned execution. With this release we have created the possibility to plan the maintenance windows even more comfortable. Any number of maintenance windows can be created individually via dashboards. This makes it even easier to plan maintenance (e.g. on machines or servers).
1.20a
Group filter for teams
In this sprint we have optimized YUNA’s unique filter system for effective teamwork. There are still private and global filters, i.e. those that a user only uses himself and those that he shares with all other users. Newly added are group filters, i.e. filters that belong to a definable team and that can not only be used but also edited by that team. This allows groups of users to see and edit exactly the filters they need.
Transfer of the current URL parameters for links (genLink)
To give dashboard developers more flexibility in widget design, we have extended the configuration of genLinks so that the currently active URL parameters can be passed in addition to the explicitly configured parameters.
1.20
YUNA is constantly being further developed so that data products can be developed and used even faster. In this sprint we have set the course for a new feature:
- With the upcoming Git integration it will be possible to import scripts directly from Git into YUNA. With this feature, data science projects can be developed and started faster and more securely
1.19
We have used the time to optimize the table widget:
- In the table widget, using the “addColumns” option, NULL values are no longer displayed as NaN. The “addColumns” option is used to dynamically add columns to the table that are returned in the result of a query.
- Dynamically added columns added by “addColumns” are now automatically removed as soon as they are no longer in the new record. The change affects data records that have been changed by a query.
- Under certain configurations the export was available – but was not performed. The behavior of the widget has been adjusted to meet the expectations of the users.
When generating a chart from a table, in rare cases it was incorrectly displayed that no numeric column was available for the chart. This has been fixed.
1.18
With Version 1.18 new features have been added:
dseconnect as REST-API
dseconnect is a connectivity-package for R, with which the interaction between scripts and YUNA is established. It offers various comfort functions such as the use of DataIDs and filters.We have extended the package, so that now any REST-APIs of external systems (like Shiny) can be addressed to use and display their results in YUNA.
-
- It can be authenticated against the system via REST-API
- DataIDs can be queried via REST and their results can be saved
Global disable automatic analysis jobs
Automatic analysis jobs can now be deactivated globally. This makes it much easier to find the cause of an error.
- Can be (de)activated in the system info widget
- Time-controlled jobs are no longer started
- Manual jobs are still started
- Jobs already running are not aborted
1.17
With Version 1.17 new features have been added:
-
Escaping in genLinks
With genLinks you can create dynamic hyperlinks in table widgets. The building blocks of a URL can be put together individually. To create a valid URL we have implemented an additional function to prevent the encoding of certain special characters and character strings. This can be done with a preceding backslash (“
\“). -
Removal of YUNAML contents under reference tags
Dashboards in YUNA are often deployed under a reference tag during development in order to limit the visibility for certain user groups. We have built in a mechanism to remove this content from the database once it has been published, for example, and is therefore no longer needed.
-
Parameters for automatic logon to target servers with CORS requests
The HTTP provider allows you to integrate HTTP interfaces into YUNA dashboards and thus integrate data from external services into dashboards or vice versa to send data from a dashboard to them. The parameter ‘
unsafeCredentialDelegation‘ of the HTTP provider allows to activate the automatic logon to target servers for CORS requests. By default, a browser policy prohibits automatic logon to a CORS request.
- As well as minor changes and bugfixes
1.16
Different database accesses from different types of circumstances
The DataSource to be used can be selected for each situation in order to restrict the database queries.
Encrypted Connections to Data Databanks
All client connections from the YUNA product environment can be configured in such a way that they only take place via encrypted connections.
JQuery in the HTML widget
It is possible to include JQuery in the HTML widget.
1.15
Cancel Stored Procedures
Stored procedures can now also be aborted.
Configuration for aborting database queries
By default, all database queries can be aborted if the respective database driver allows this. This can be changed globally via the service configuration, using the -tag for individual DataIDs.
DataID-Provider
The DataID Provider allows you to call DataIDs and provide the respective results via IO-Channel.
Releases from the year 2019
Show me!
December 2019 – 1.14
HTTP Provider
New YUNAML component that enables the integration of external HTTP APIs into dashboards.
Enhanced logging
The output of certain return values from function calls in the script log is no longer suppressed
November 2019 – 1.13
Shiny widget authentication in YUNA
By using the iFrame widget, it is now possible to integrate Shiny apps. To be more precise, Shiny apps can now access and use data that is available in YUNA. The authentication via YUNA makes it possible to configure the access of the Shiny app with the roles and rights.
Result rating: Evaluate analysis results at the touch of a button
With the result rating, an important and convenient tool was developed in the last sprint that improves analysis and its results in an even shorter time. The moment the analysis scripts deliver their first results, they can be evaluated faster and checked for correctness by using the result rating. The results are played back to the script, so that data scientists can adapt their scripts accordingly. The feature itself greatly shortens the time it takes to do this.
In the new version, usage has been significantly improved: The results can now be evaluated conveniently and even faster via keyboard entry. The assignment of the keys is freely selectable and can be adjusted by each user according to his preferences.
Form widget: Data can be passed to a stored procedure
From now on, it is possible to pass the data, which is sent via the form widget, to a stored procedure. With stored procedures you can call predefined procedures and multiple statements from the database client. Thus, the dashboard developer has among others the greatest possible freedom to return user input to the system for further analysis.
Localization extended
It is now possible to translate the contents of CDATA blocks, popups, all tooltips and items in the filter widget. CDATA blocks prevent the parser from interpreting special characters like „<„.
Our localization resolves this block and allows the translation of its content.
Special characters in sourced objects
The use of special characters in the names of parameters in the HTML widget caused errors in script mode. Special characters such as „_“ can now be used to name HTML parameters in script mode.
Jump start now – we will walk you through it!